Data Through Design 2024
In March 2024, DxD presented our seventh exhibition at BRIC featuring nine works under the theme Aftermath. The exhibition included video, a home-made ATM machine for tax lot data, a speculative post-climate change vision of how we might use data in the future, a physical urban planning visualization, a simulated gas stove with inflatable burners, stories of the Freshkills land fill, plants as sensors, rat sightings chronicled in a light sculpture, and soil movement in a tufted rug; all derived from New York City Open Data.
The artists participated in a discussion moderated by Stephen Larrick, and the exhibition was visited by multiple university and high school groups in addition to the general audience.

Theme: Aftermath
We live in a perpetual state of aftermath. The data we collect today represent reverberations of past events; edited, interpreted, and distilled to tell a story of history. Data drives our narratives and shapes not only the future but also our vision of the future — a narrative of us and where we expect to be. Who is telling that story, and how does the aftermath of events shape how it’s told?
This year, we invited artists to explore how data reflects (and does not reflect) these lived aftermaths and to interpret the idea of aftermath through data. How does data define and organize time and space in our articulations about the world? How has the past molded our present and how will we sustain our future? Will we drown in a flood of information or make meaning from the mess?
2024 Projects & Artists
Parcel ATM
Though often invisible, tax lots are an essential part of the financial machinery of cities – and a contested space. Parcel ATM is an automated telecommunications device built to inspect this machinery, allowing you to search through 21 years of NYC tax lot data. While these data catalog tax lots in technical terms (LandUse, BldgClass, ZoneDist, ResFAR, OwnerName, etc.), they reveal much more, telling the regulatory, socioeconomic, and built history of New York City. Dive in, "Visit the Parcel ATM at parcels.nyc".
Raphaël Laude

Rezoning: at What Cost?
Gowanus, Brooklyn has undergone massive changes due to the neighborhood rezoning that was approved in November 2021. Public policy is often hard to decipher and sometimes hidden from the people that it impacts the most. Rezoning: At What Cost? embeds previously indigestible data into physical form while providing spatial context to understand the data’s implications. By inviting users to engage with a physicalization of the data, this project builds a connection between people and policy.
The map of Gowanus is a future snapshot of all buildings currently permitted for construction since the rezoning. Each residential building is a combination of colored acrylic floors depicting the percentages of market rate and affordable housing. The audience can play with the data by taking off floors of buildings and rearranging them. An accompanying zine that provides more context and doubles as a worksheet to see how they do or do not fit into the NYC affordable housing system.
Data: DCP Housing Database, HPD Affordable Housing
Tatiana Lahera Kalainoff

Chaosphere
Chaosphere is an interactive installation that looks at yearly trends in cooking gas usage in New York City. Through interacting with the inflatable burners on a stove, participants will look at monthly gas usage as well as brief video compilations of the related triumph, controversy, and hardship experienced by the human race in recent years. The piece uses cooking as a starting point to examine the tension between the aftermath of a chaotic world and the essence of living, fertility, and community.
Data: Cooking Gas Consumption And Cost (2010 - Feb 2023), NYC Building Energy and Water Data Disclosure for Local Law 84 (2023-Present)
Angel Mai, Zongze Chen, Sharell Bryant, Yitong Chen

Emissions of a Real Fantasy:
The Aftermath of Fresh Kills
Emissions of a Real Fantasy surfaces over two decades of operational records at Fresh Kills landfill. Buried within Open Data’s archive, these textual records describe the day-to-day workings of the once-world’s-largest landfill. Snippets of these texts are envisioned emitting from the hundreds of gas wells dotted across the digitally simulated landscape. The texts rise into the sky, persisting above the monumental backdrop of what is now Freshkills Park, offering quirky callbacks and retorts to the social and environmental practices that undergird the landform below. The land speaks about its history through these quotes, recalling the myriad scientific, political, and cultural standings of the stakeholders and laborers that heavily formed every inch of the site.
Data: DSNY Solid Waste Management Freshkills documents, 1 foot Digital Elevation Model (DEM)
Helmuth Rosales

NYC Clock
Clock time is not an absolute truth but a cultural artifact. The project asks what it would mean to create our own clock, utilizing data from something we care about as a time-giver.
In a city like NYC, where values such as "Mind your own business" and "Time is money" dominate, we propose a speculative visualization and installation inspired by the designer’s experiences in crisis as a means to challenge this perception. The project utilizes data on the number of people seeking help (including 911 End-to-End, NYPD Calls for Service, 311 Service Requests from 2010 to Present, 311 Call Center Inquiry), alongside other installation clocks like a nature clock (sunset-sunrise data), a business clock (UTC time), and a Myself clock (sleep and awake data). As a prototype, this clock offers multiple avenues for usage and interpretation, envisioning future clocks that could connect to various data sources through open APIs.
Data: 911 End-to-End, NYPD Calls for Service, 311 Service Requests from 2010 to Present, 311 Call Center Inquiry
Saralee Sittigaroon and Ziyu Zhang

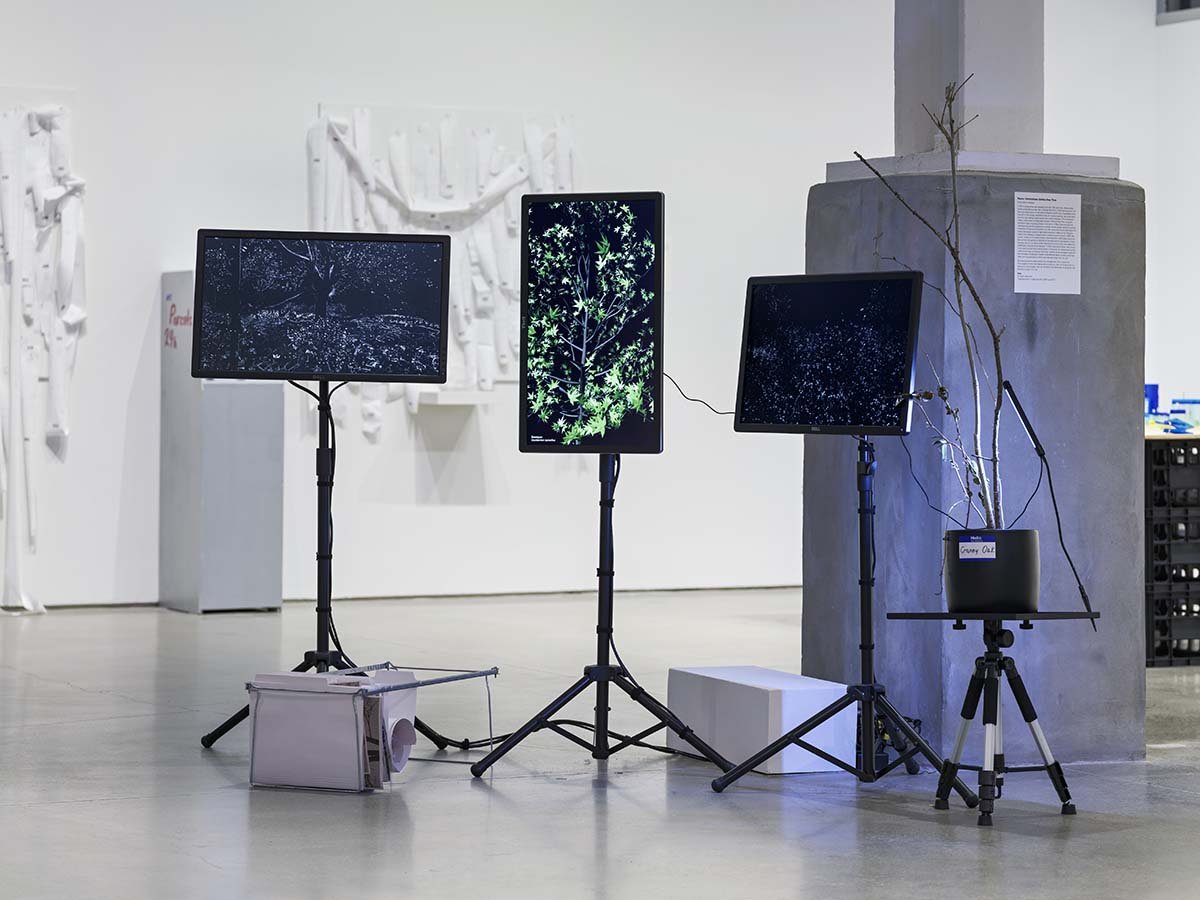
Plants: Informational Entities Over Time
In 2017, a large white oak believed to be over 200 years old—affectionately known as the Granny Oak—fell in Pelham Bay Park. In the clearing where the oak once stood, trees, shrubs, and herbaceous plants have responded to the hole left in the canopy. Multiflora rosa, an invasive species, has since taken over the site making native species few and far between. This installation makes visible years of landscape change in Pelham Bay Park using the entitation maps originally piloted in the park in 1986 to demonstrate the informational potential of plants as a marker of time, and by extension, political investment. Focusing on entitation unit 1001 where the Granny Oak stood, the project develops a series of high-fidelity botanical models of the 18 plants listed in the catalogue to depict what it looked like at the time of a 2007 site survey. Intermixed with LIDAR data, the animations attempt to reconstruct the plant community based on these data sources. Plants are presented here as a living sensors or data points, as records for the aftermath of ecological and political change in the city.
Sonia Sobrino Ralston
Soil on the Move
My ongoing representation research thread develops novel soft representation methods through textiles that I call Ecological Communication Devices. Mapping natural systems through textiles creates a haptic artifact at scale that is responsive to water, material, and pressure. It also mimics weathering and aging that occurs in landscapes. Through this research, I am exploring tools to develop environmental literacy and understanding of the significant opportunity to teach through touch. Building on this methodology, Soil on the Move will be a representation project that maps dynamic and soft ecological systems. In this project I will be mapping the aftermath of soil movement and remediation, in contrast with where New Yorkers live and work. Anchored by the data from the NYC Clean Soil Bank, this textile will map where nature moves in the city, and what neighborhoods are being extracted from and who is benefiting from over 600,000 tons of soil movement over the years. Through this mapping I hope to draw connections between clean soil movement and environmental justice populations, understanding where ecological investments are being made, and if it’s an equitable system.
Data: NYC Clean Soil Bank Generating and Receiving Sites, Land Cover Raster Data (2017), Environmental Justice Area Census Tract Designation
Sophie Weston Chien

Pockets of Information:
Community Care in a Speculative New York
Pocket of Information explores how a community-oriented information sharing model could take place in the aftermath of severe climate change in New York City. It takes a solarpunk approach to imagining our relationship to the land and each other. Taking inspiration from WWII bomber jackets, which were lined with maps to assist pilots in navigation if their planes went down, it is a garment-based resource map. Instead of a bomber jacket, it is a chore coat, a garment associated with care and maintenance and not war and colonialism, and instead of having the map on the lining, which only benefits the wearer, the map is on the exterior of the jacket so others can view and benefit from the information.
Data: Borough Boundaries, Parks Properties, Sea Level Rise Maps - 2050s 100 year Floodplain, NYC Greenthumb Community Gardens, Green Thumb Site Visits, New York City Bike Routes
Claudia Berger and Gabriella Evergreen

Rat Revolution
Rat Revolution chronicles rat sightings in New York City from 2010 to 2023. Crafted with acrylic, light bulbs, and translucent paper, the 4-foot tornado-esque lantern represents a 3D polar plot. Acrylic rings denote months, led light colors signify temperatures, and the radius mirrors rat sightings. Viewers navigate freely, discovering details like heightened summer rat sightings and yearly surges. The bulbs and rat shadows guide the audience on a journey through the dataset from 2010 to 2023, and the aesthetic brilliance juxtaposed with the hidden nature of rats encourages contemplation on the complex relationship between humanity and these elusive creatures.
Data: 311 Service Requests Dataset from NYC OpenData, Monthly Mean Avg Temperature for Central Park, New York from National Weather Service
Danny Yang, Lesley Huang, Pia Bocanegra and Linda Yang

All 2024 Photography by Sebastian Bach
Sponsors
Presented by BRIC
NYC Office of Technology and Innovation (OTI)
Pratt School of Information
2024 DxD Organizers
Julia Bloom, Tereza Chenaki, Rachel Daniell, Jack Darcey, Sara Eichner, Sofia Martynovich, Jen Ray, Justin Roberts, Can Sucuoglu, Wenfei Xu