

Data Through Design 2026
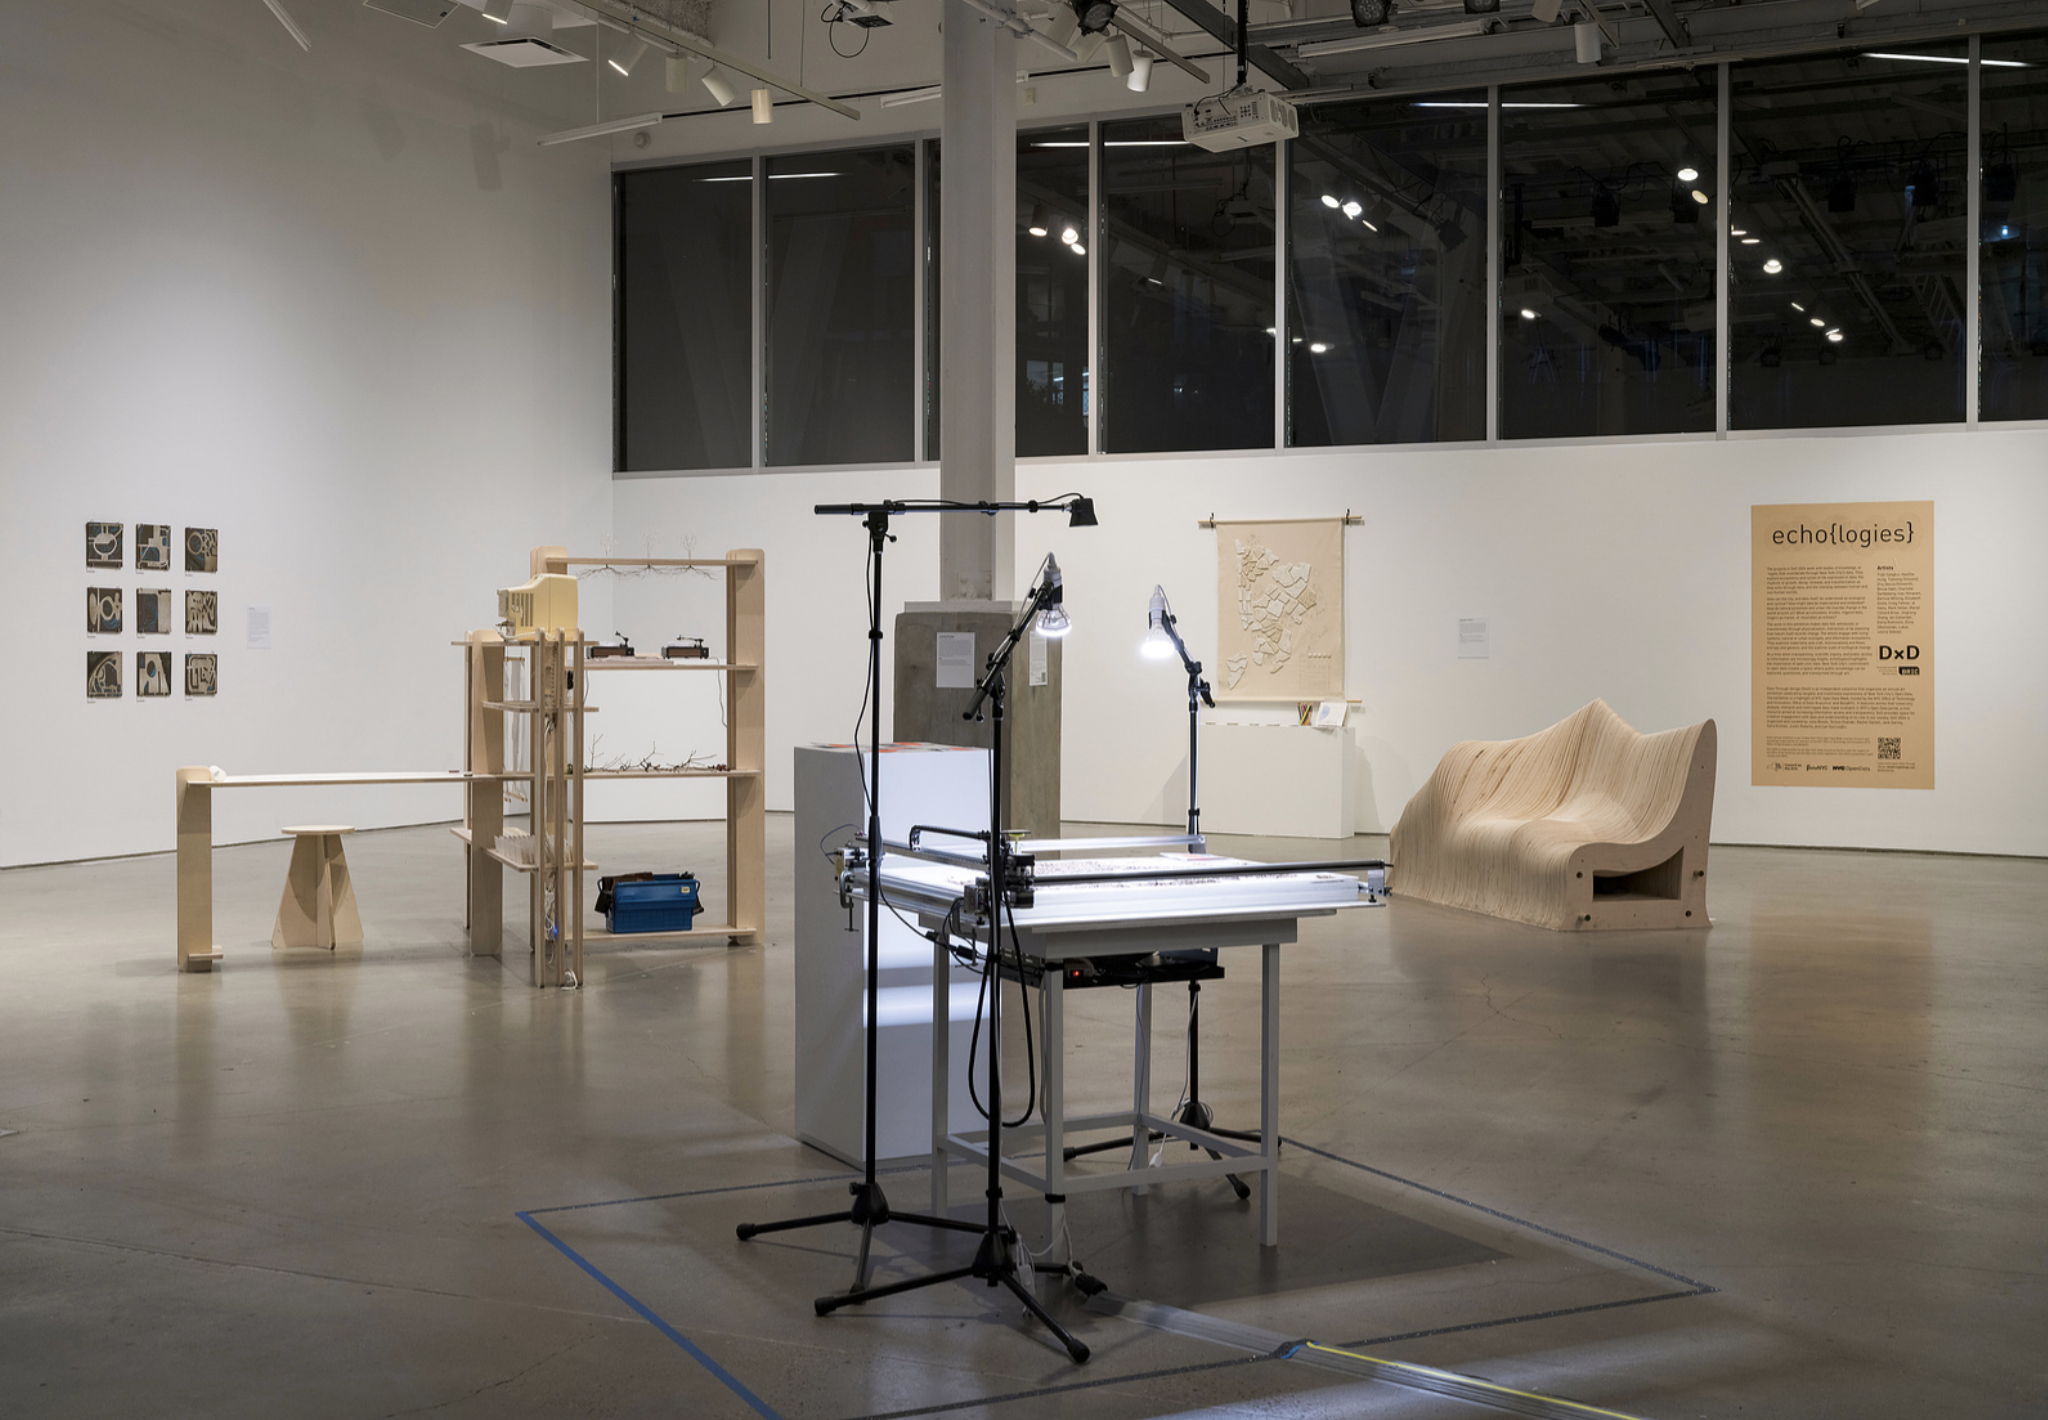
In March 2026, DxD presented our eight exhibition at BRIC featuring 10 works under the theme echo{logies}.
Theme: echo{logies}
The 2026 projects work with the bodies of knowledge, or “-logies”, that reverberate through New York City’s data. They explore ecosystems and cycles of life expressed in data; the rhythms of growth, decay, renewal, and transformation as they “echo” through data, and the interplay between human and non-human worlds.
Echo{logies} engages ith questions such as: How can the city, and data itself, be understood as ecological and cyclical? How might data be materialized, embodied, or inscribed by natural processes? What accumulates, erodes, regenerates, lingers as traces, or resonates as echoes?
The artworks engage with living systems, natural or urban ecologies, or information ecosystems, and examine materiality and craft, murmurations and flows, entropy and genesis, and the sublime scale of ecological change.
2026 Projects & Artists
Desire Paths
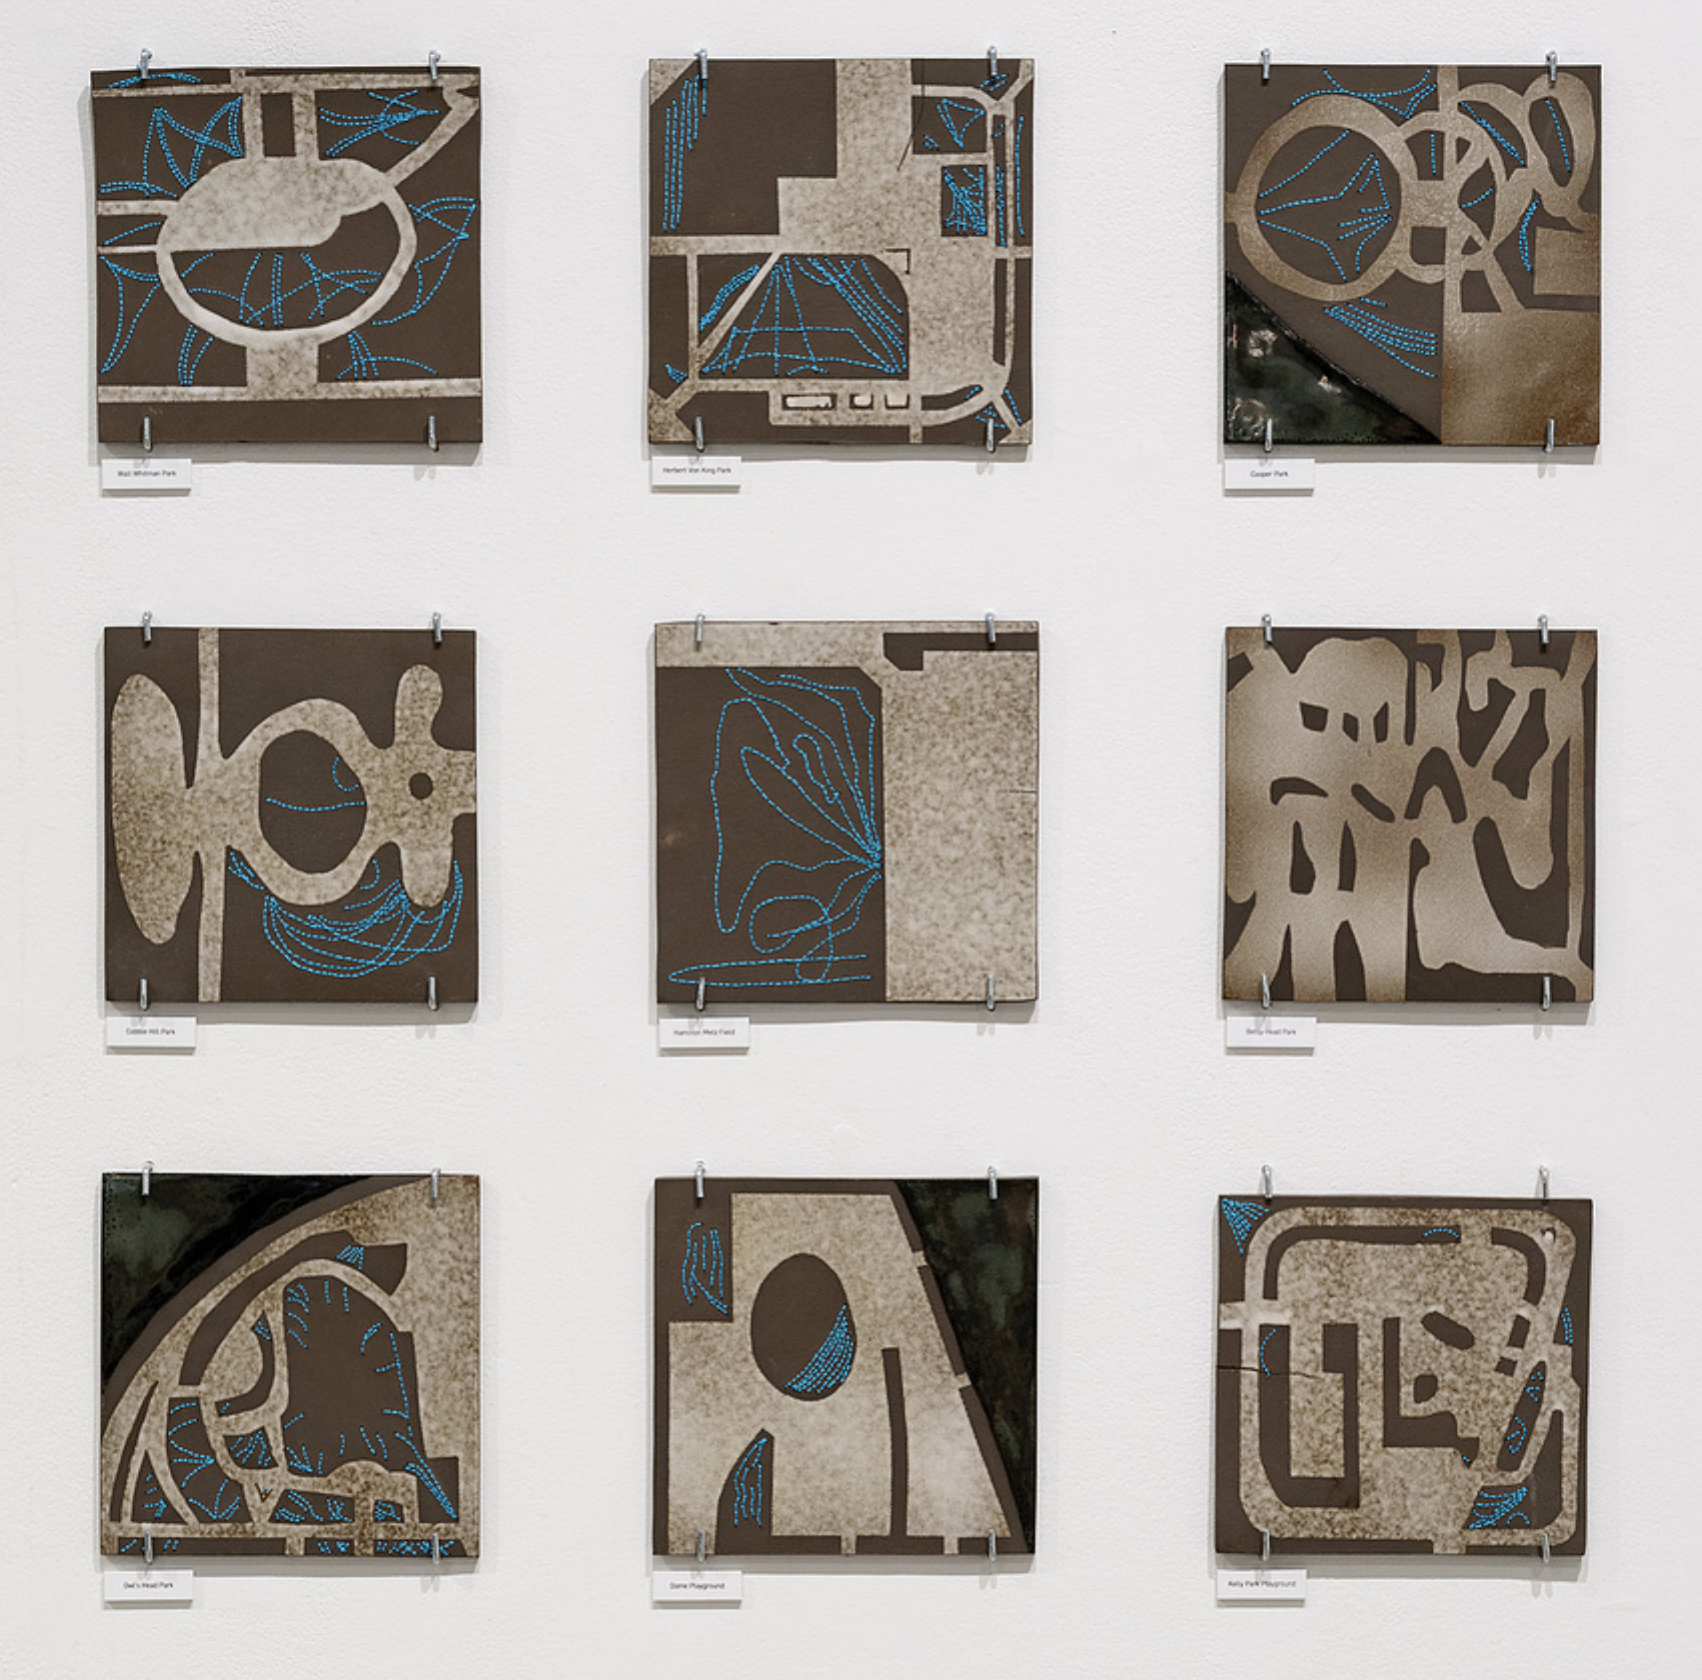
Desire Paths draws on Parks datasets to examine the ecological rhythms of movement within New York City public spaces. By mapping “desire paths”, or the informal pathways formed by repeated human movement, the project explores the interplay between designed landscapes, human behavior, and the forces that erode urban ecologies over time. Rendered as a mosaic composed of nine threaded and glazed clay tiles, the artists examine how human and natural systems continually shape the living, evolving landscapes of the City’s parks.
Becca Ellsworth & Becca Odell
Datasets used:
Observational data at park locations
Open Street data for paved trails
HartLine
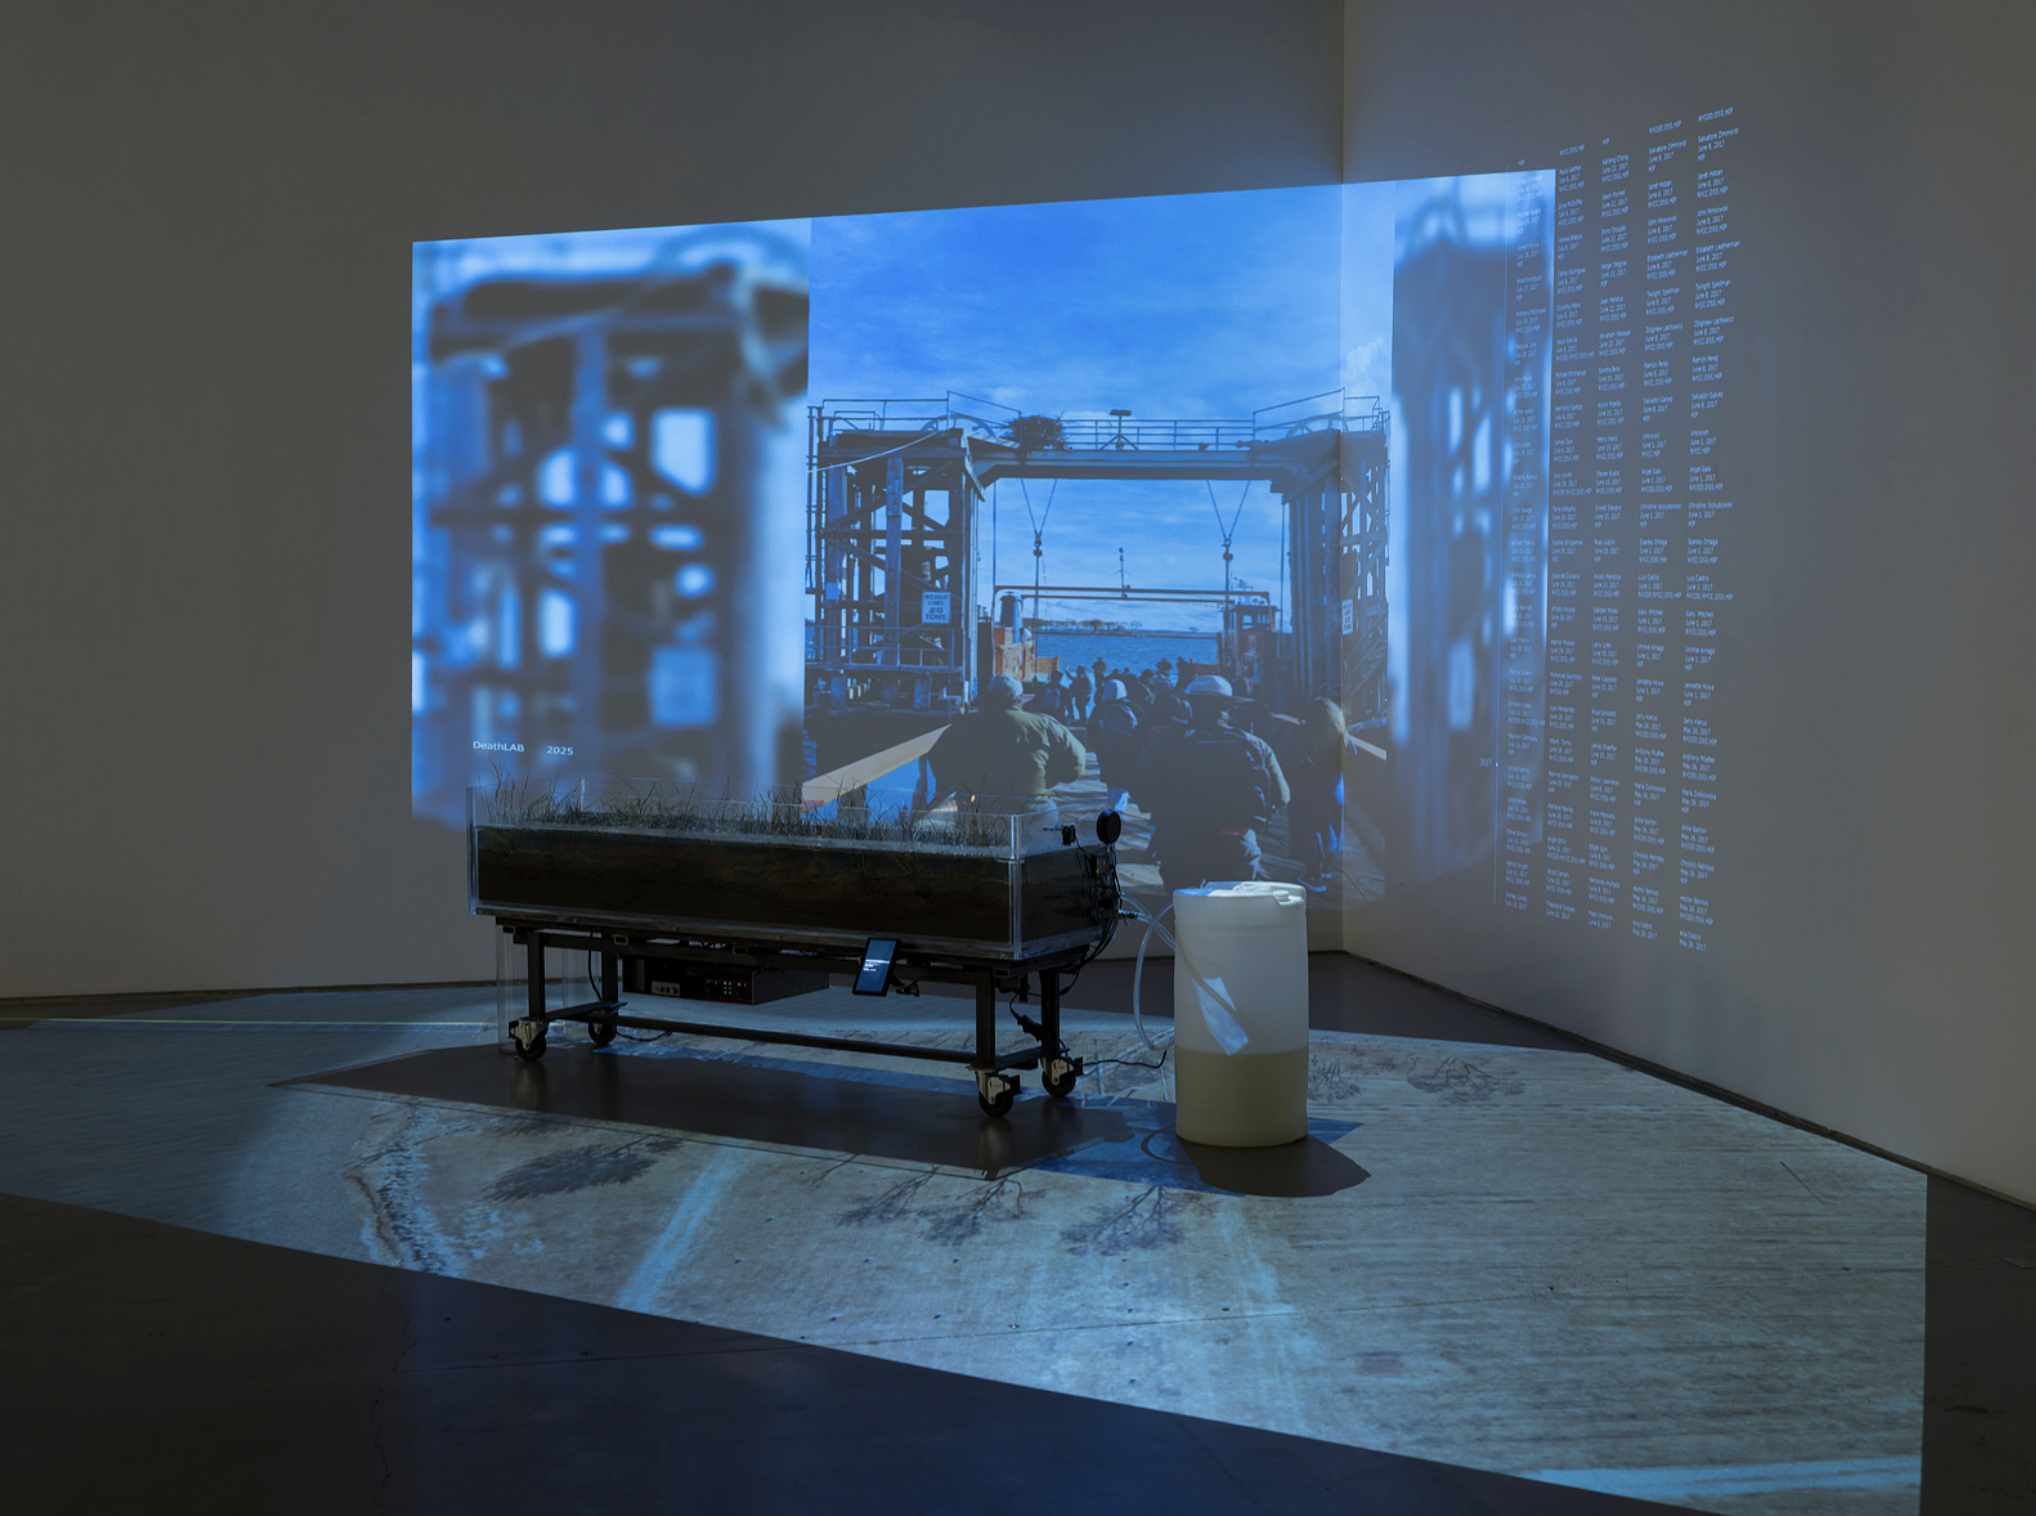
HartLine is a constructed wetland biome exploring mortality, computation, data, and environment as intertwined material processes.
Hart Island is New York City’s public burial ground. For more than 150 years, the island has been reshaped by tides, weather, and the burial of, by some estimates, over one million people. It remains an infrastructure of burial and a largely inaccessible landscape of collective memorialization.
Between 1981–2021, bracketed by the AIDS crisis and the COVID-19 pandemic, roughly 83,000 individuals were interred. Public datasets are fragmented: some contain names and dates, others mostly unknowns. Together they expose decaying structures of access and information.
HartLine presents a semi-controlled aqueous environment where corrosion, ion drift, root infiltration, projection, and tidal cycles operate as a single computational ecology. Over twelve days, it speaks the name of each person interred. This signal first passes through a steel plate and copper panels which, together with brackish water, form a short circuit. As plant-driven corrosion accumulates, conductivity shifts, and the transmission gradually clarifies. Only through decay, and the new growth it inspires, does the computational process become functional.
Over time the system becomes its own dataset: an evolving archive defined not by empirical representation but by material transformation.
Ian Callender & Karla Rothstein
Datasets used:
Hart Island Burial Records, NYC Open Data
Wetlands, NYC Open Data
Traveling Cloud Museum Data Set, The Hart Island Project
Landscape Workshop
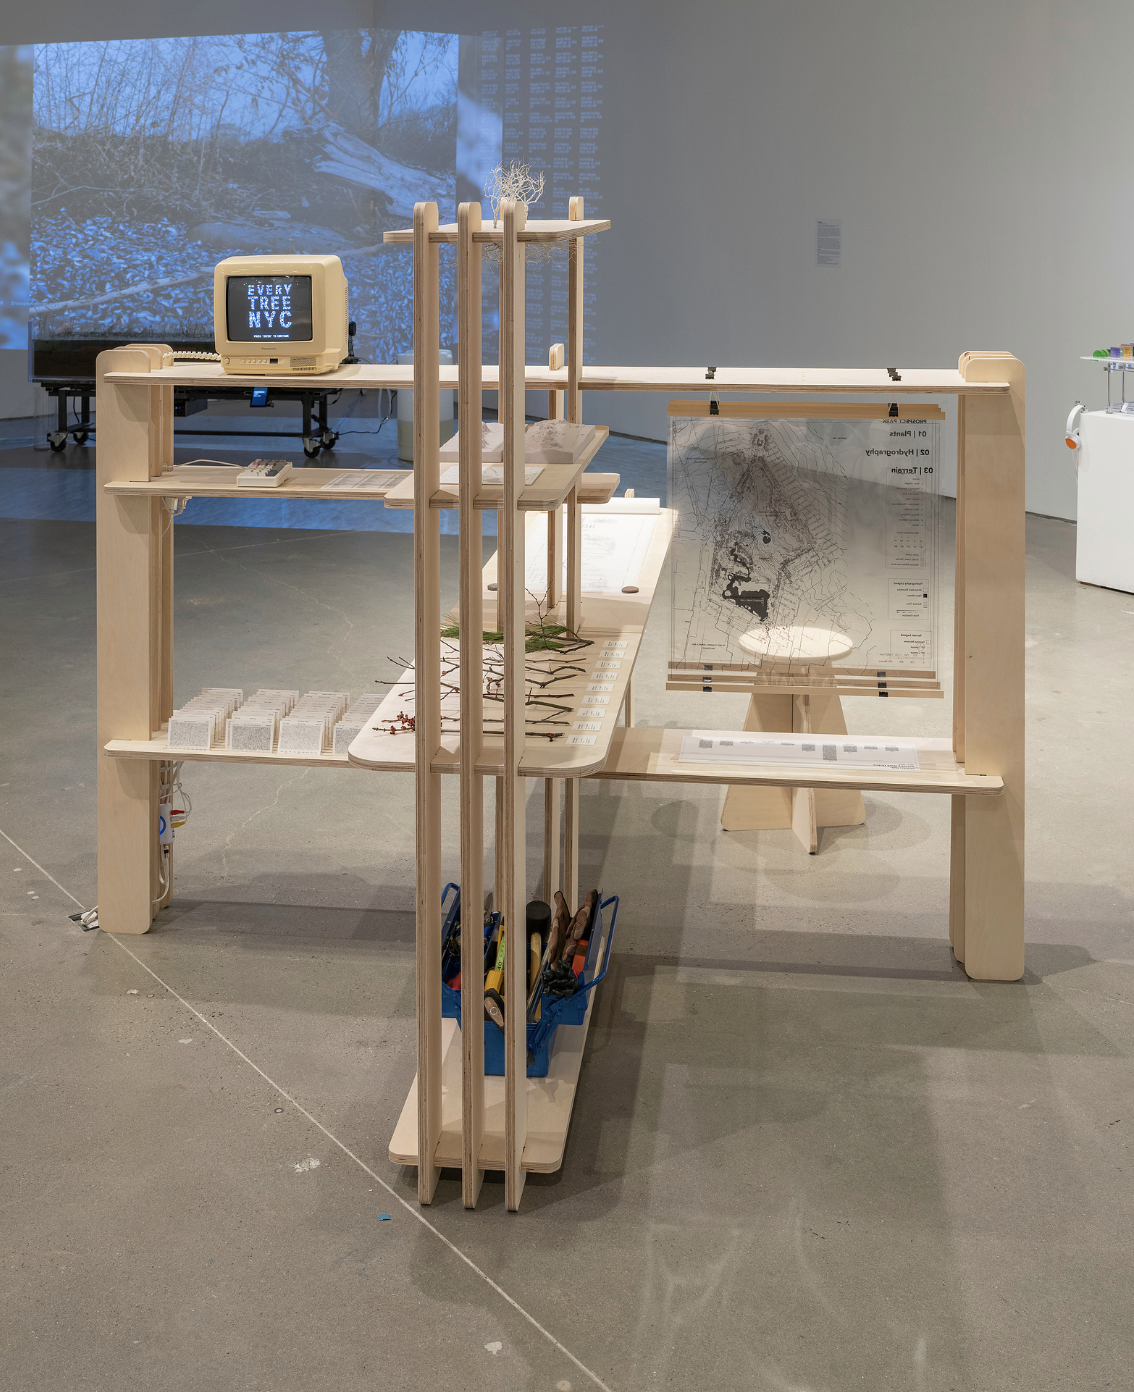
Landscape Workshop invites the public to experience the varied ways landscape architects use geospatial data to study, draw, and ultimately produce spaces of ecological diversity within New York City. The piece explores how we reconstruct the urban forest not just through individual trees, but in conjunction with other ecological datasets as well as on-site ground truthing. Through digital and analog components, the installation mirrors the hybrid practice of landscape architecture: drawing with pencil and mouse, registering through data and sensory experience. A love letter to the craft, the piece reimagines the spatially distinct settings of computer, modelshop, garden, and desk as one amalgamated landscape workshop, across which open data represents the city through digital and physical forms.
Mark Heller & Mariel Collard Arias
Datasets used:
DPR Forestry Tree Points
DCP Neighborhood Tabulation Areas
OTI Land Cover Raster 6” (2017)
OTI 1 foot Digital Elevation Model (DEM)
Linger Loiter
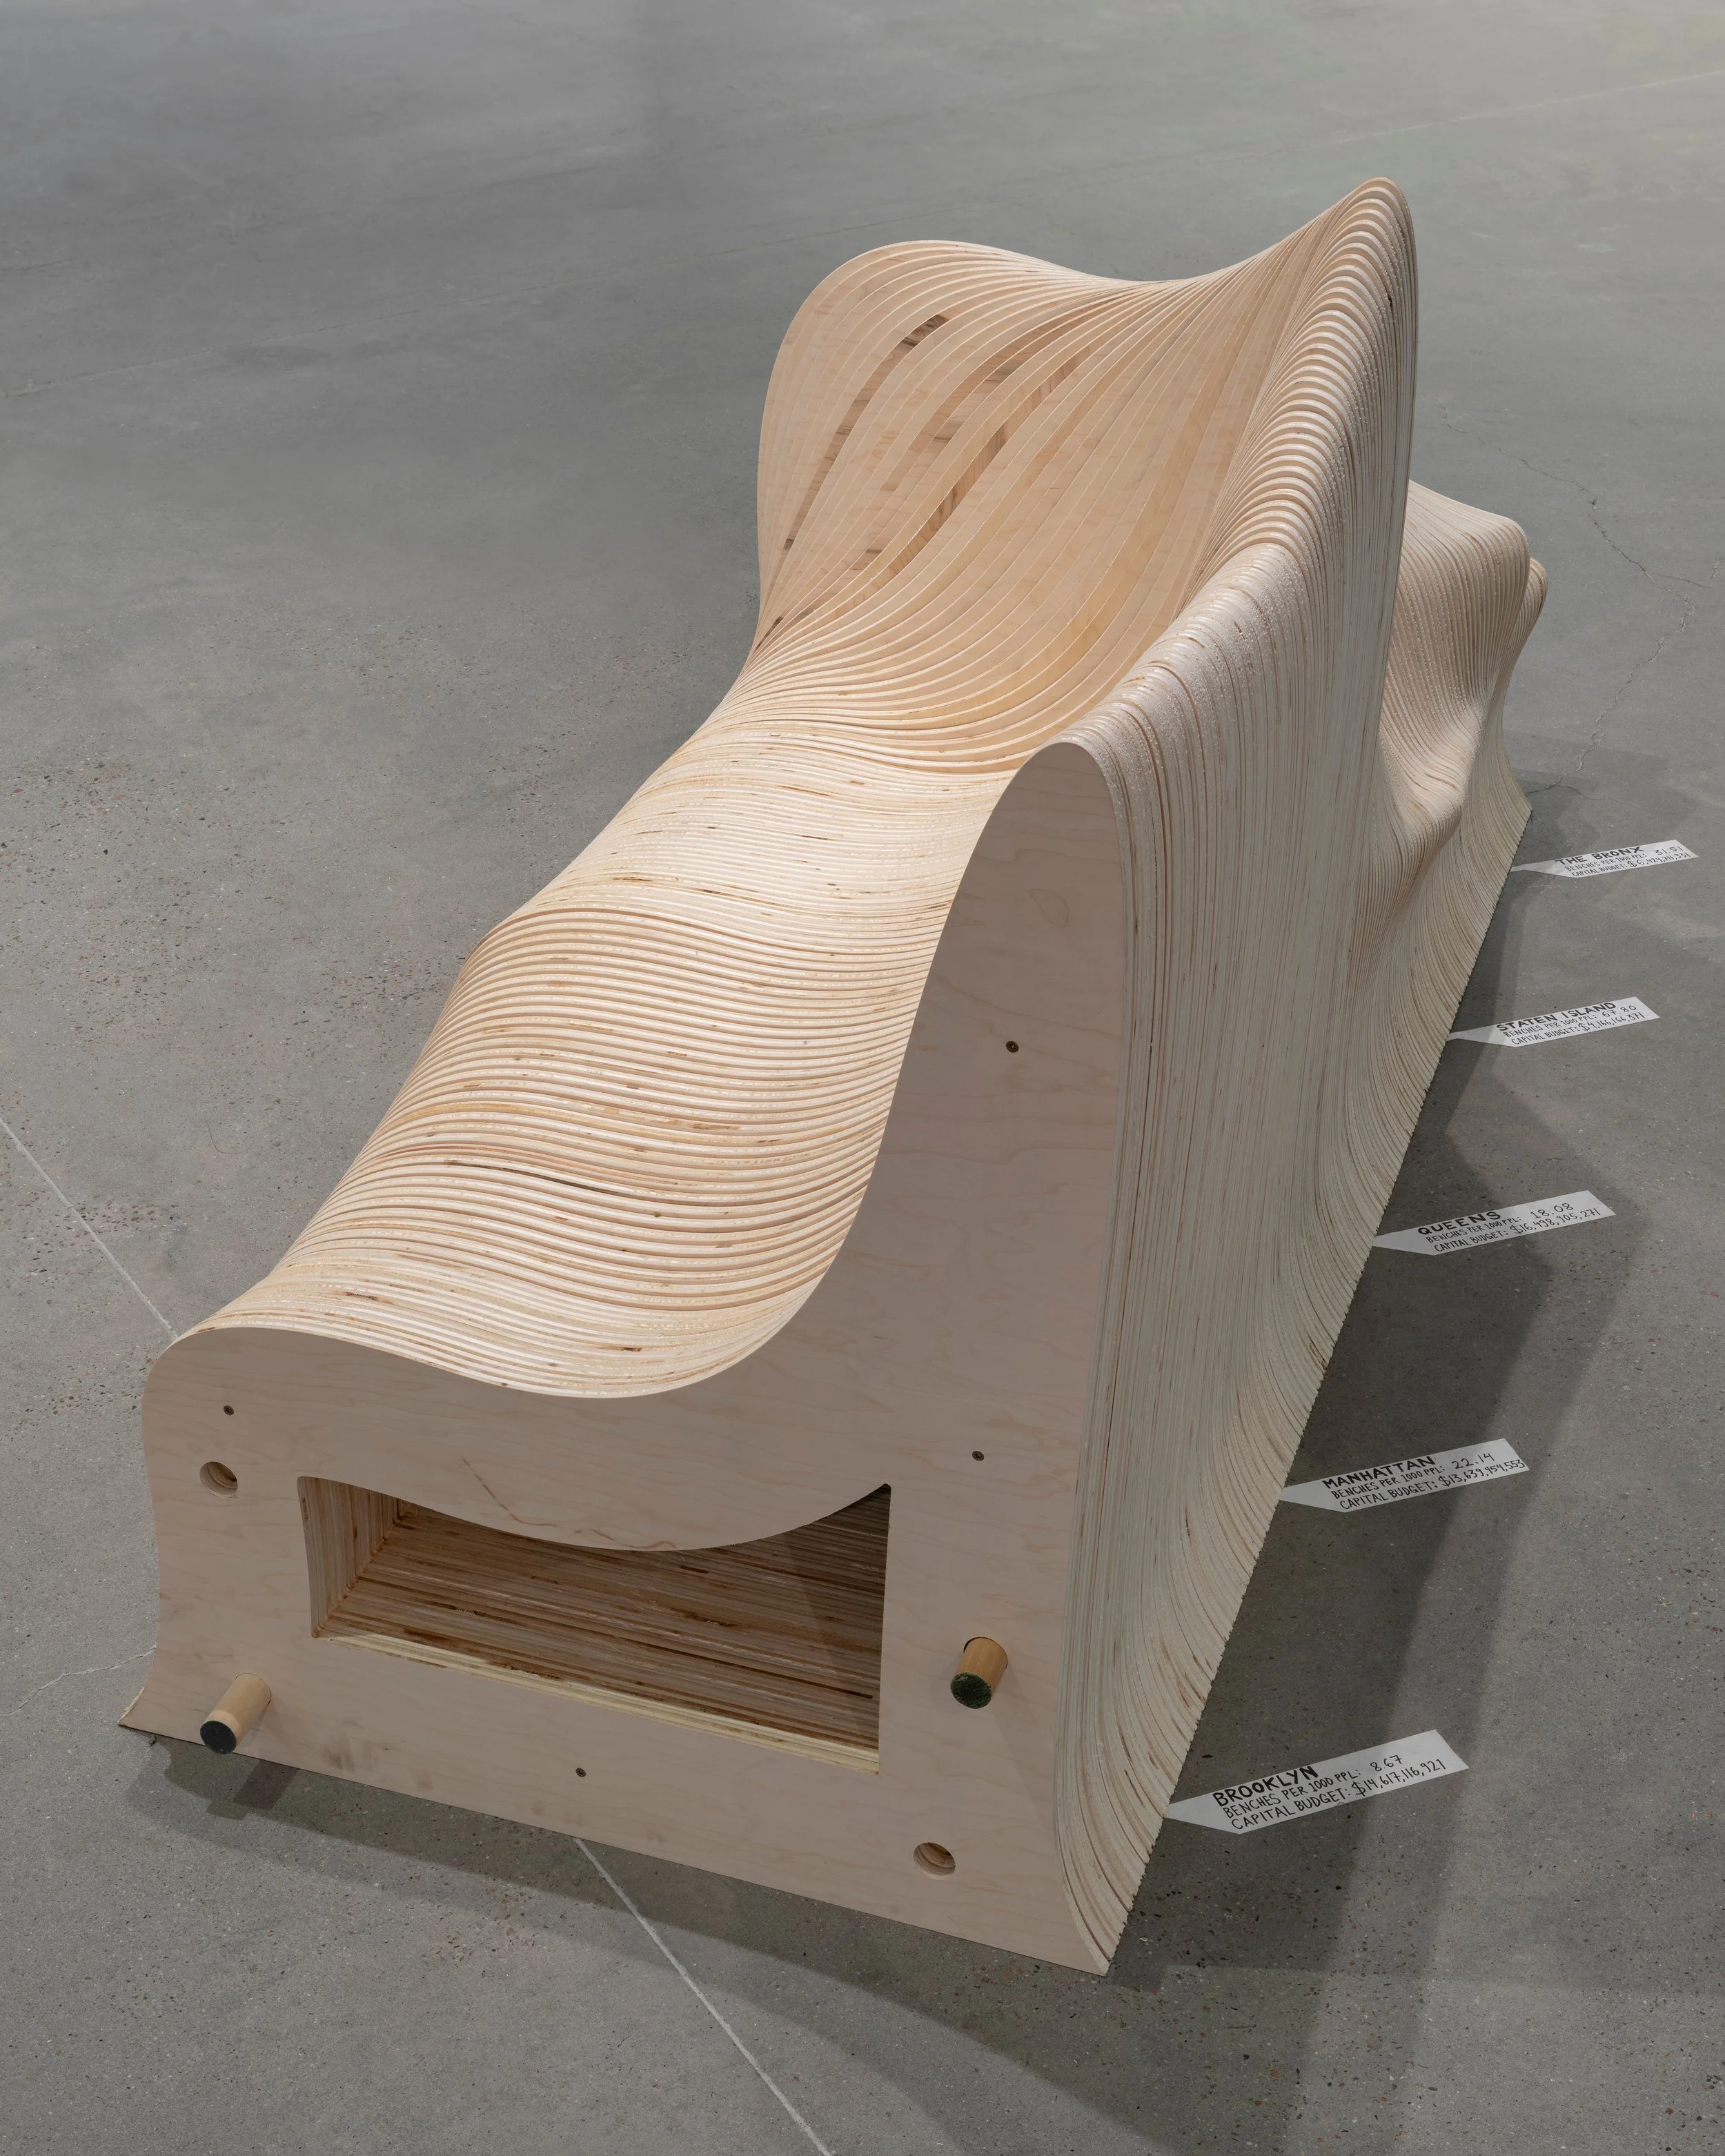
Public benches are a place of pause and convergence, but their distribution is shrinking and their design grows hostile. Our infrastructure discourages us from lingering or loitering.
Linger Loiter is a bench that embodies the uneven presence of this resource throughout each borough. The undulating seat was designed by analyzing publicly-available data on benches per thousand people in Brooklyn, Manhattan, Queens, Staten Island and the Bronx. Similarly, the height of the back corresponds to how much capital budget is dedicated to each of those boroughs. Paired with this physical manifestation of seating “deserts” and “oases” are recordings of different scenes on public benches around New York City—an incensed renter phoning her sister, a mother comforting her crying child, a group of unhoused strangers gathering for a Sunday chat.
We encouraged viewers to sit, immerse themselves in these essential nodes of public life and contemplate what our urban environment would be without them.
Charlotte Gartenberg & Ivan Himanen
Datasets used:
City bench locations (DOT)
Seating locations (DOT)
Accessible parks facilities and programs (Parks Department)
Capital Budget (OMB)
NYPD Complaint Data (NYPD)
Metropolitan Cuneiform
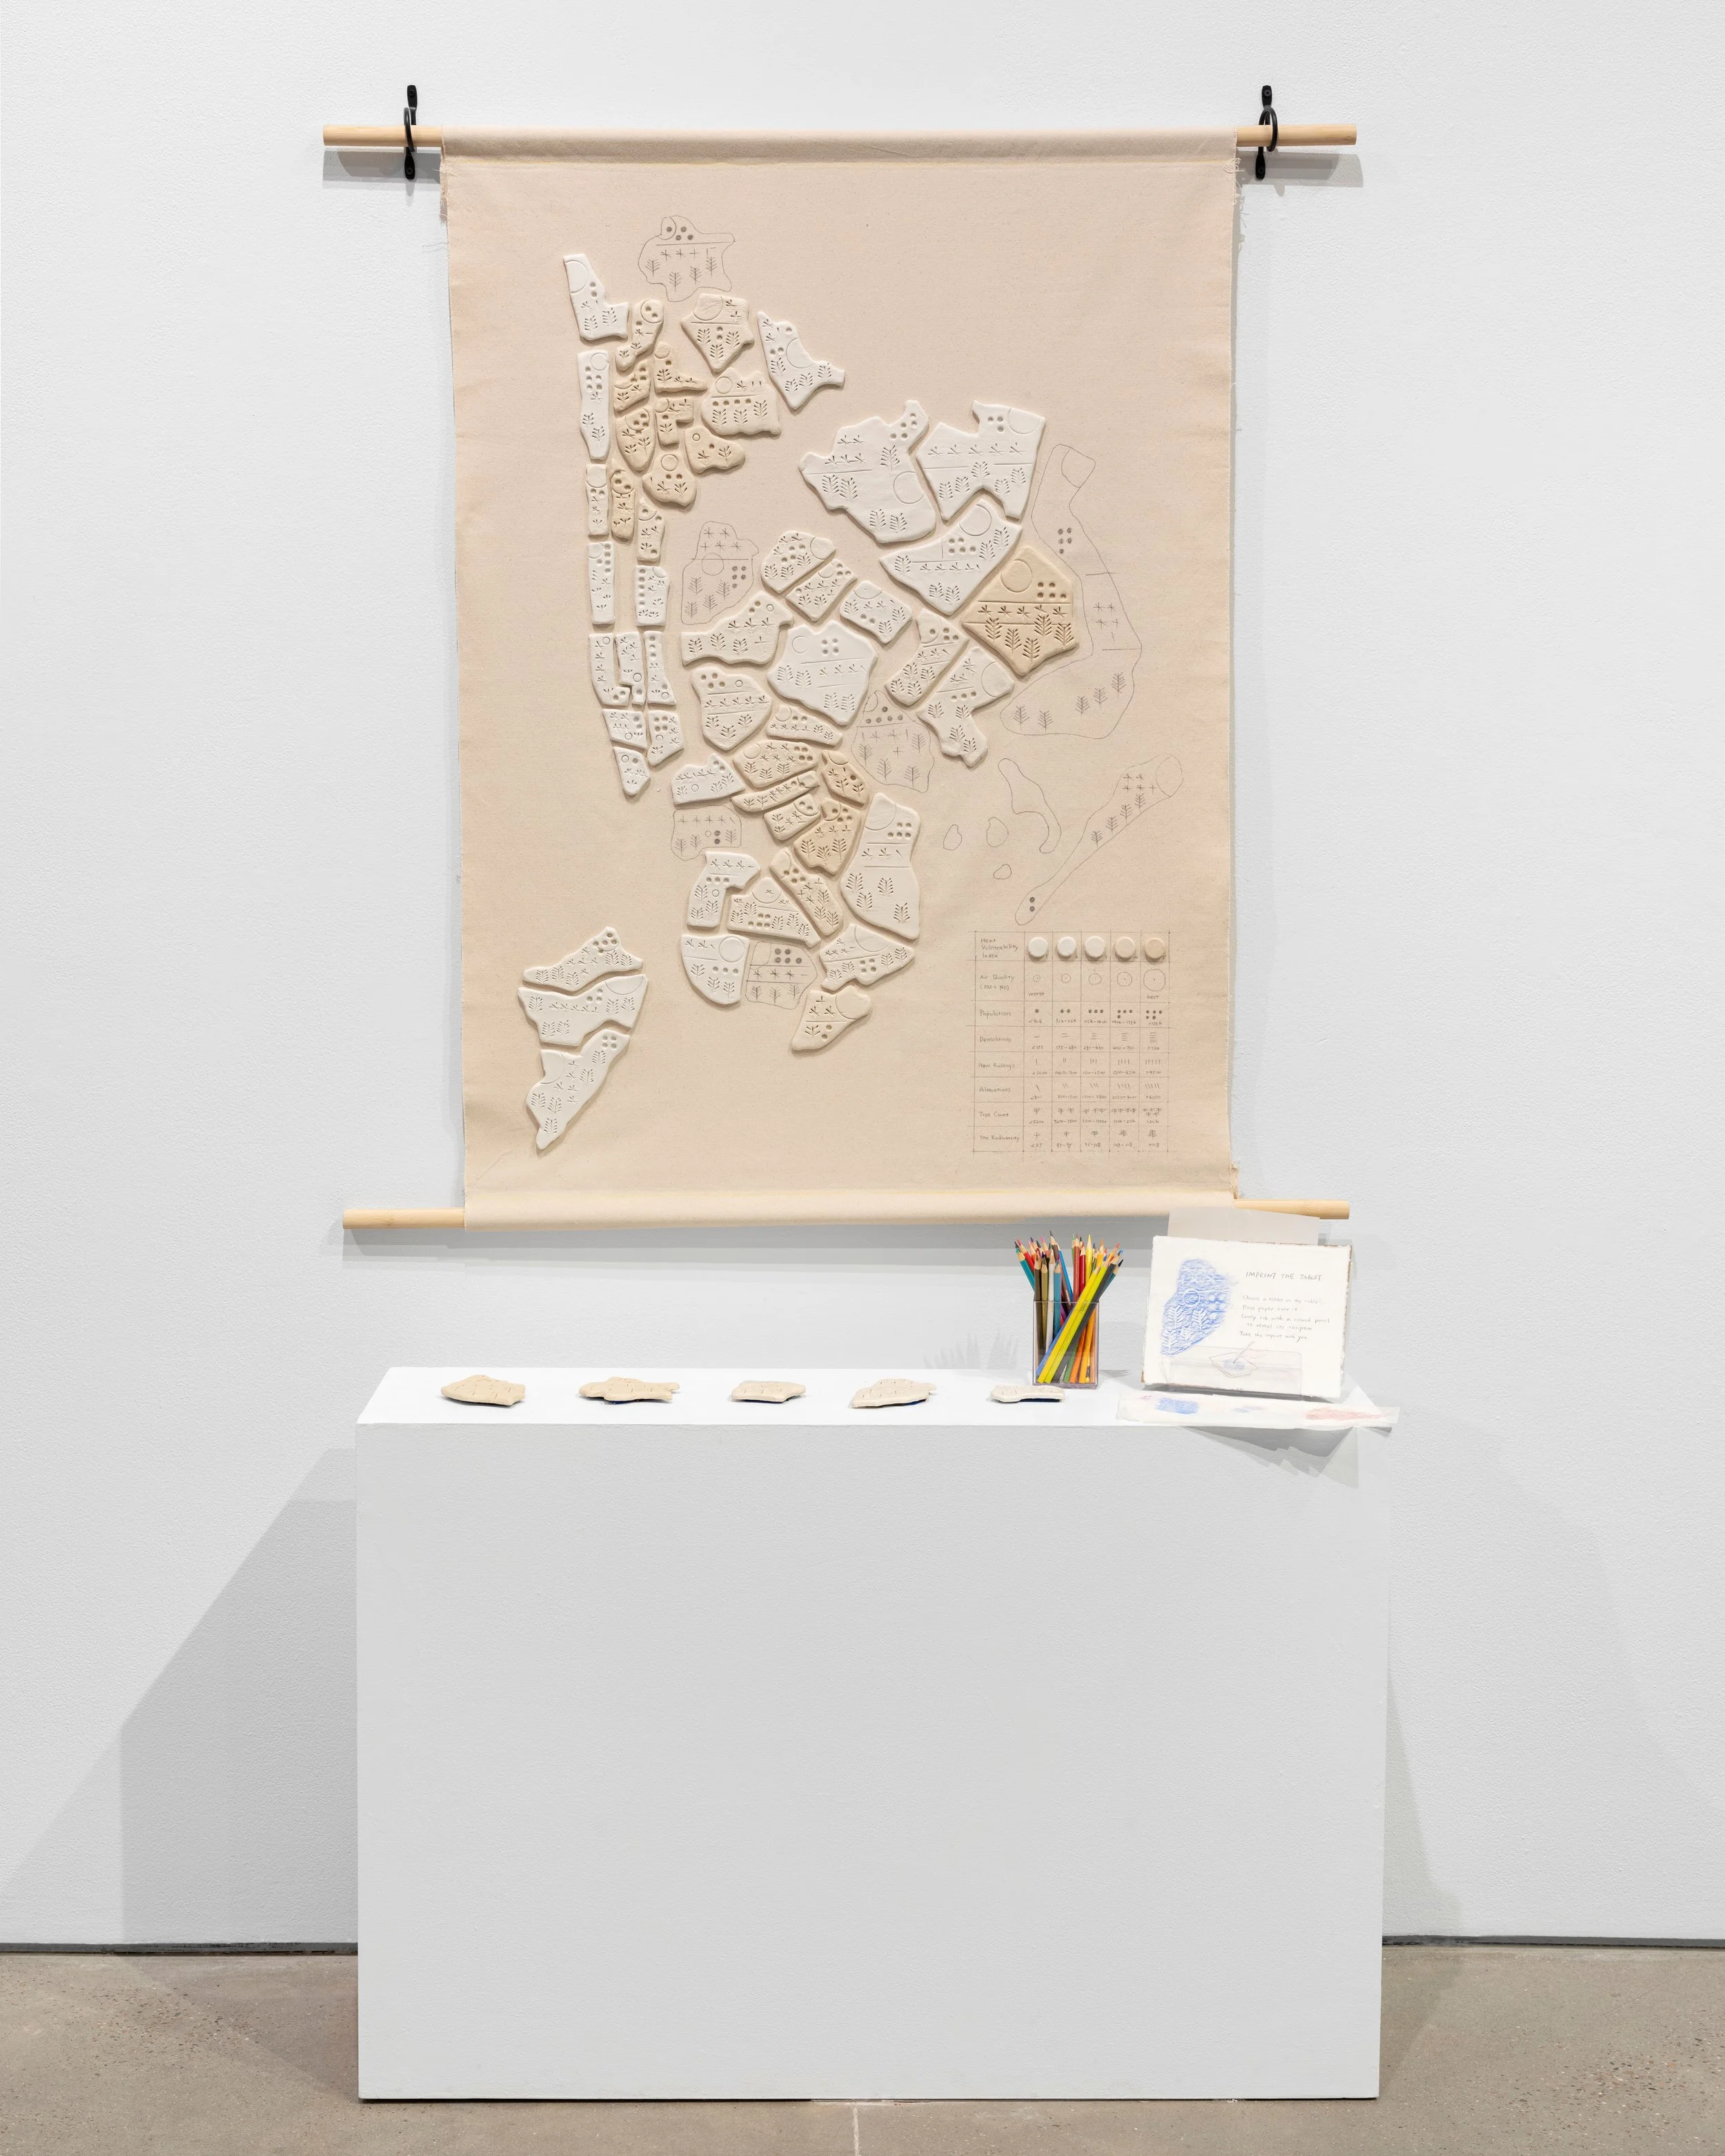
Metropolitan Cuneiform transforms New York City’s environmental and urban datasets into hand-engraved clay tablets inspired by ancient cuneiform writing. Using symbols derived from street trees, building activity, population exposure, and atmospheric conditions, while embedding urban heat vulnerability directly into the clay’s material color and texture, the work treats contemporary data as future archaeological evidence. By translating open data into tactile inscriptions, the project reframes urban ecology as a system of trace, erosion, and memory—inviting viewers to read the city through material marks shaped by both human and environmental forces.
Jingrong Zhang
Datasets used:
Street Tree Census
Heat Vulnerability Index
DOB NOW: All Approved Permits
The Oracle of Gotham
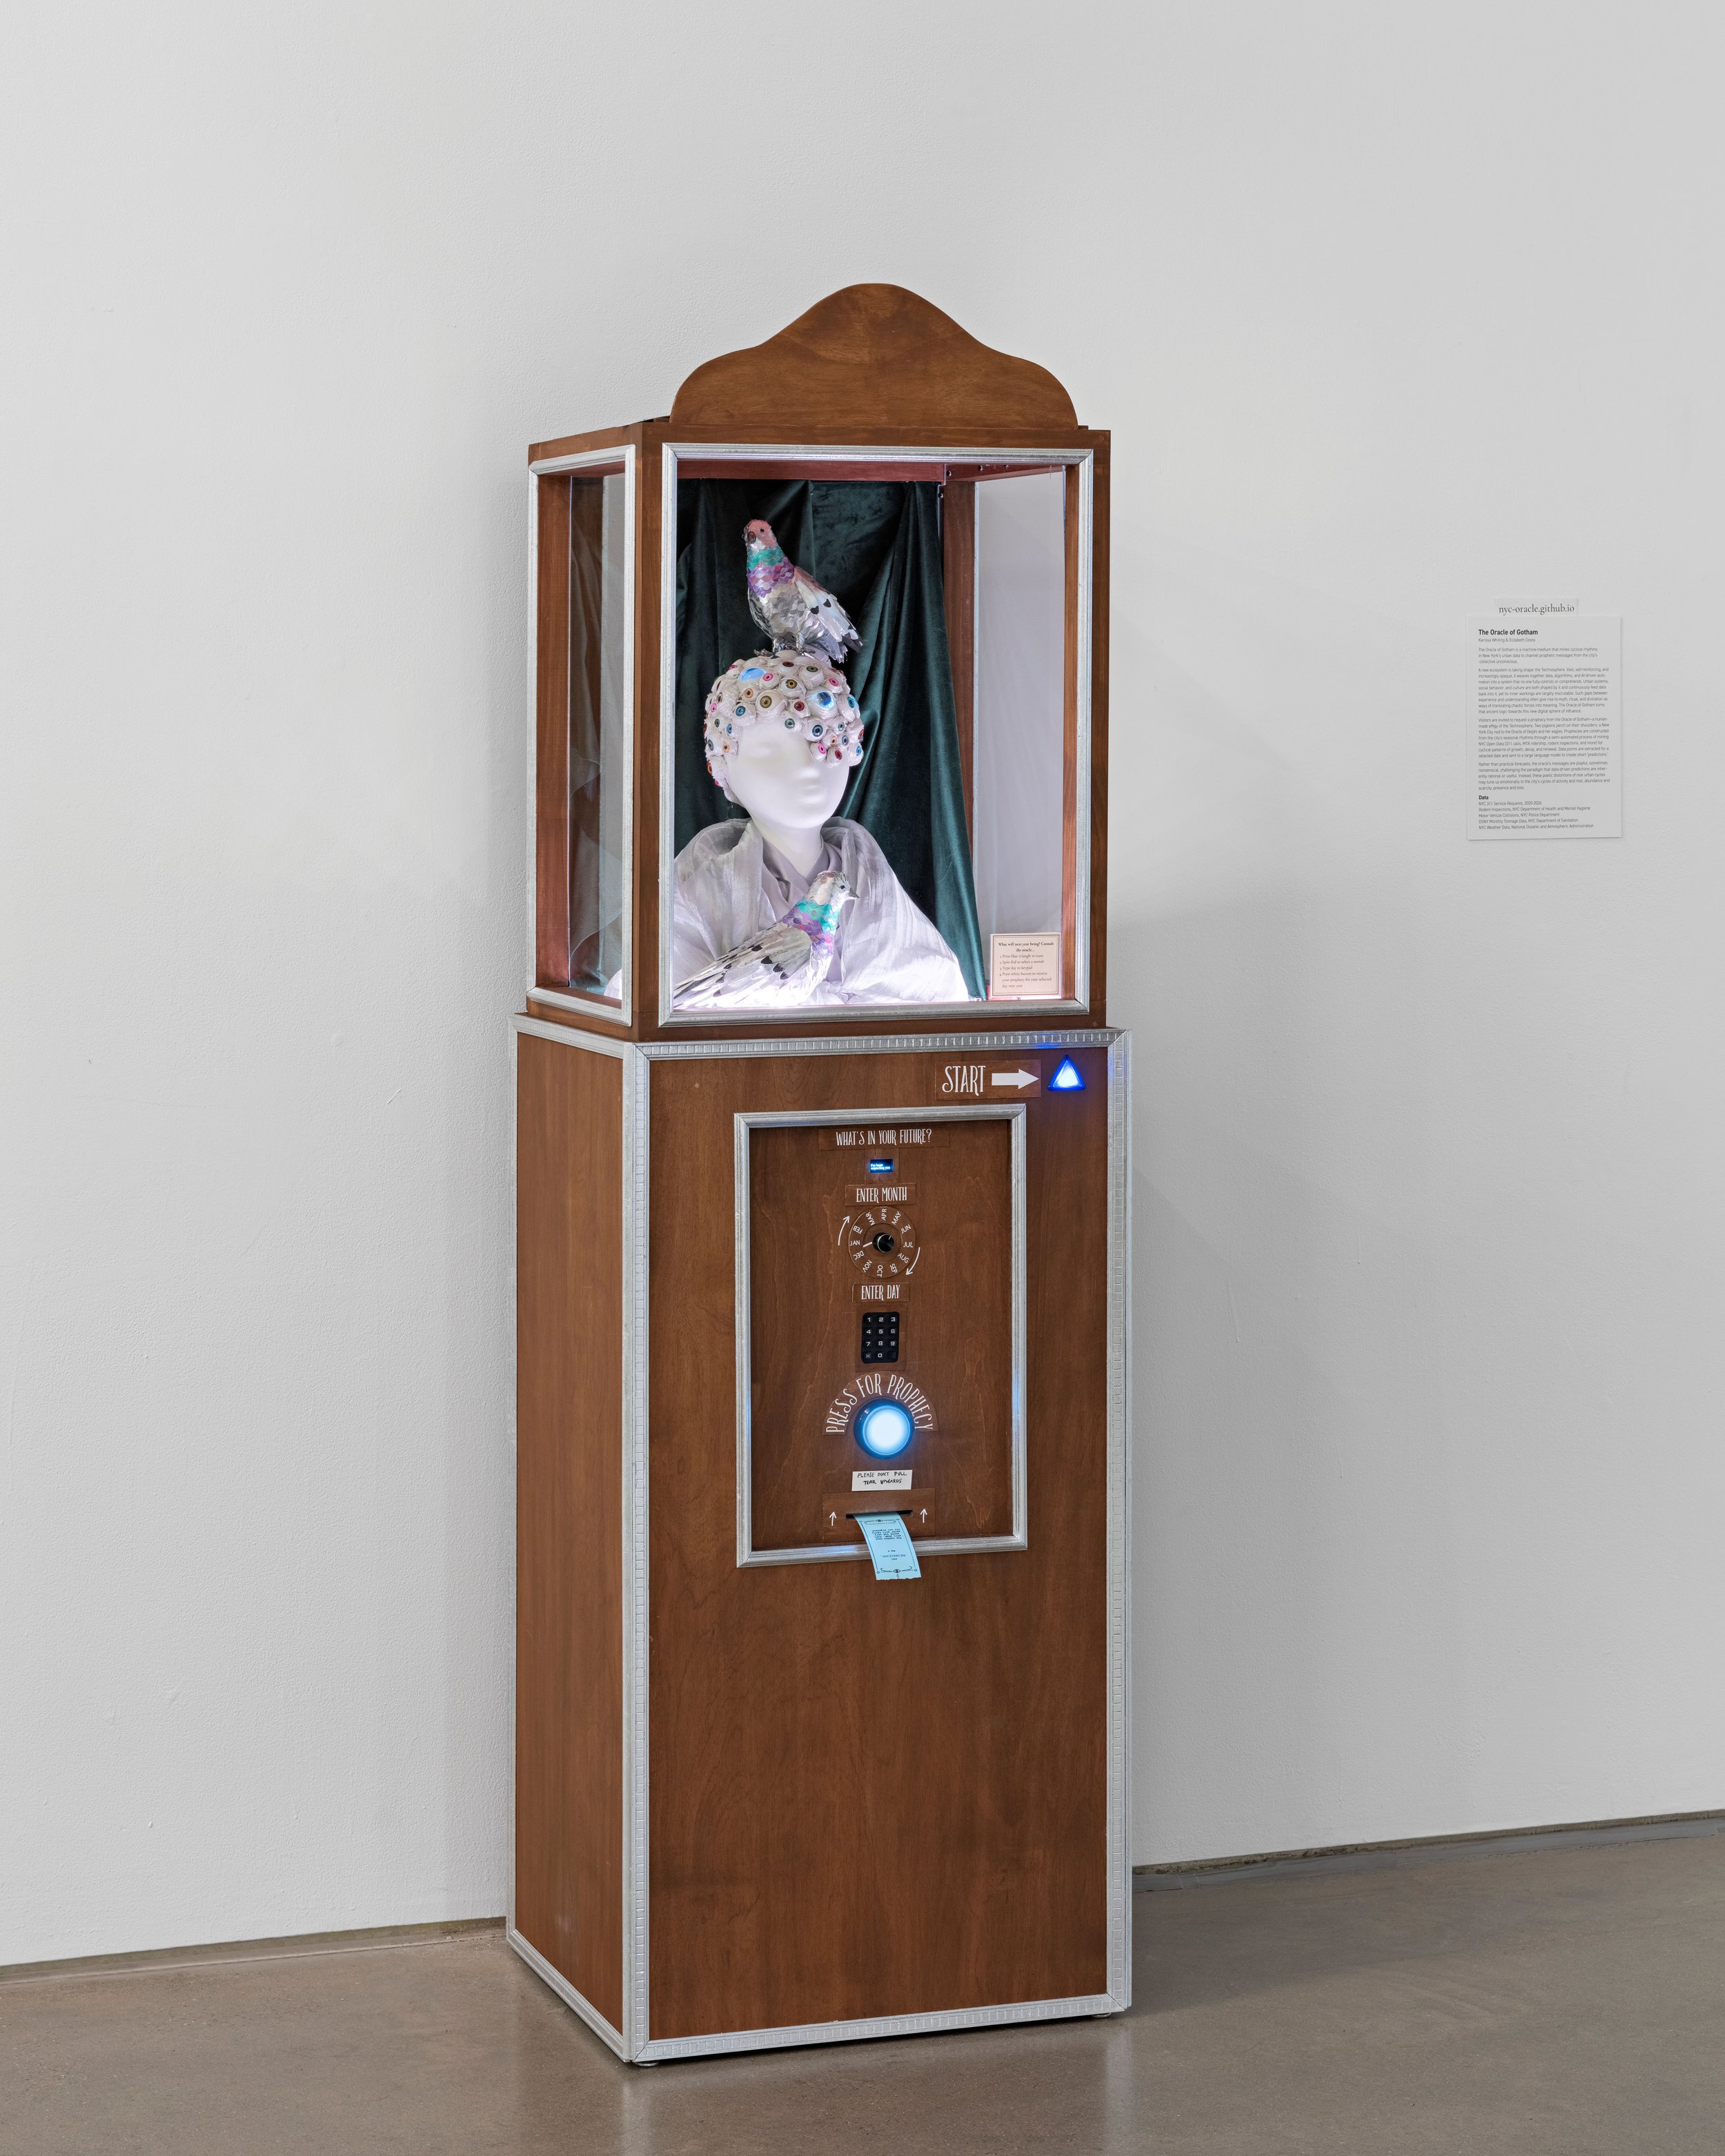
The Oracle of Gotham is a machine-medium that mines cyclical rhythms in New York’s urban data to channel prophetic messages from the city’s collective unconscious.
A new ecosystem is taking shape: the Technosphere. Vast, self-reinforcing, and increasingly opaque, it weaves together data, algorithms, and AI-driven automation into a system no one fully controls. Urban systems are both shaped by it and continuously feed data back into it, yet its inner workings are largely inscrutable. Gaps between experience and understanding often give rise to myth, divination and the impulse to give the unknown a body. The Oracle of Gotham turns that ancient logic towards this new digital sphere.
Visitors are invited to request a prophecy from the Oracle of Gotham—a playful effigy of the Technosphere. Two pigeons perch on their shoulders, a New York City nod to the Oracle of Delphi eagles. Prophecies are constructed from the city’s seasonal rhythms, emerging from a semi-automated process of mining NYC Open Data for cycles of growth, decay, and renewal. For each date, patterns from historic data (311 calls, arrests, rodent inspections, water quality, dog bite data) are extracted and sent to a large language model to generate short ‘predictions’ for next year.
Rather than practical forecasts, the oracle’s messages are irreverent, sometimes nonsensical, challenging the paradigm that data-driven predictions are inherently rational or useful. Instead, these poetic distortions of real urban cycles may attune us to the city’s cycles of activity and rest, abundance and scarcity, presence and loss.
Karissa Whiting & Elizabeth Costa
Datasets used:
311 Service Requests, NYC Office of Technology and Innovation
Rodent Inspection Data; Dog Bite Data, NYC Department of Health and Mental Hygiene
NYPD Arrests Data, NYC Police Department
Watershed Water Quality – Limnology, NYC Department of Environmental Protection
Turnstile Murmurations
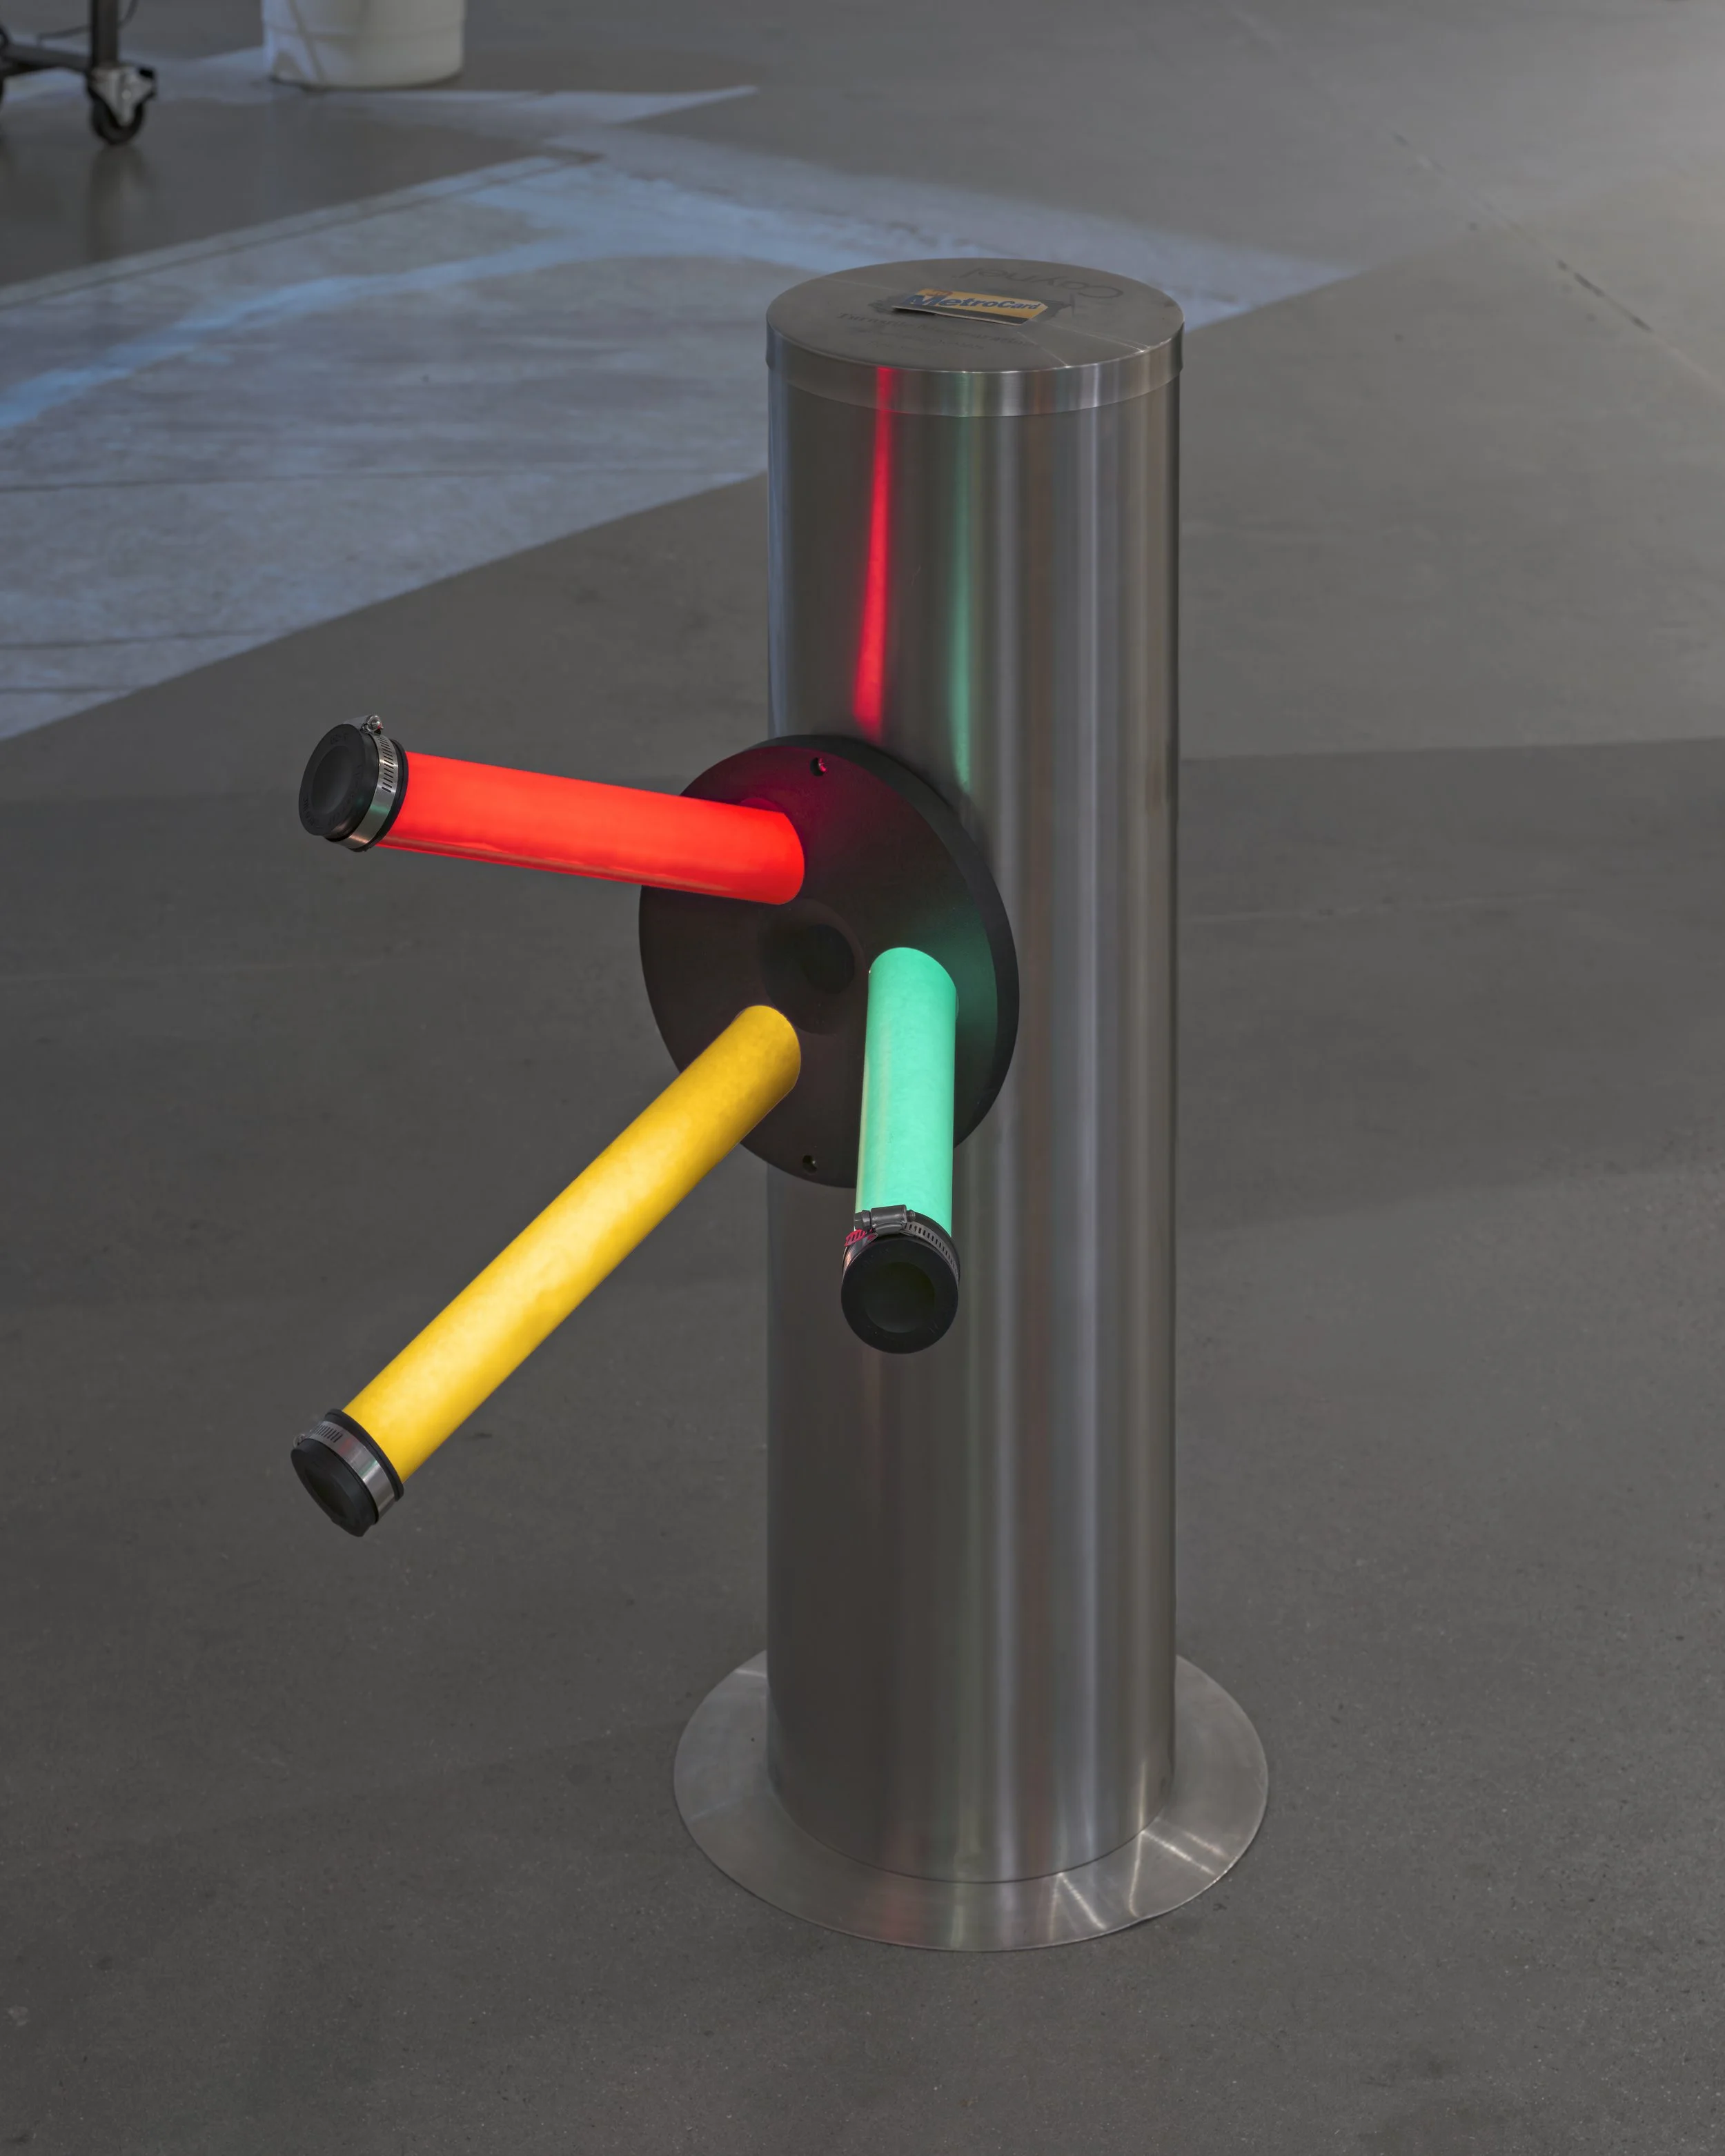
Every day, millions of subway riders pass through turnstiles across New York City. Turnstile Murmurations reimagines this familiar infrastructure as a system that registers collective movement rather than regulating passage.
Ridership data from the 1/2/3, 4/5/6, and N/Q/R lines brings the sculpture to life: bright, rapid pulses signal rush hour traffic, while soft glows mark the lulls. By referencing the MTA Arts & Design dataset - specifically, Dan Flavin’s Grand Central and Sol LeWitt’s Columbus Circle installations - the piece connects commuters to NYC art history embedded within the transit system.
The sculpture echoes the New York Minimalist tradition, where the materials of the street become the medium of the gallery. Industrial LEDs, echoing Flavin’s use of standardized light found in hardware stores, replace mechanical rotation with illumination. Following LeWitt’s conceptual approach, the instructions executed by a microcontroller guide the work: the artist designs the system, but the city performs it.
By translating invisible urban rhythms into spatial experience, Turnstile Murmurations reframes infrastructure as choreography, subtly shaping how bodies move, wait, and belong. The work does not merely represent New York; it listens to it, allowing light to record the City’s living tempo as a luminous murmuration.
Trpti Sanghvi
Datasets used:
Urban Data Orchestra: Composing the Hidden Rhythms of the City
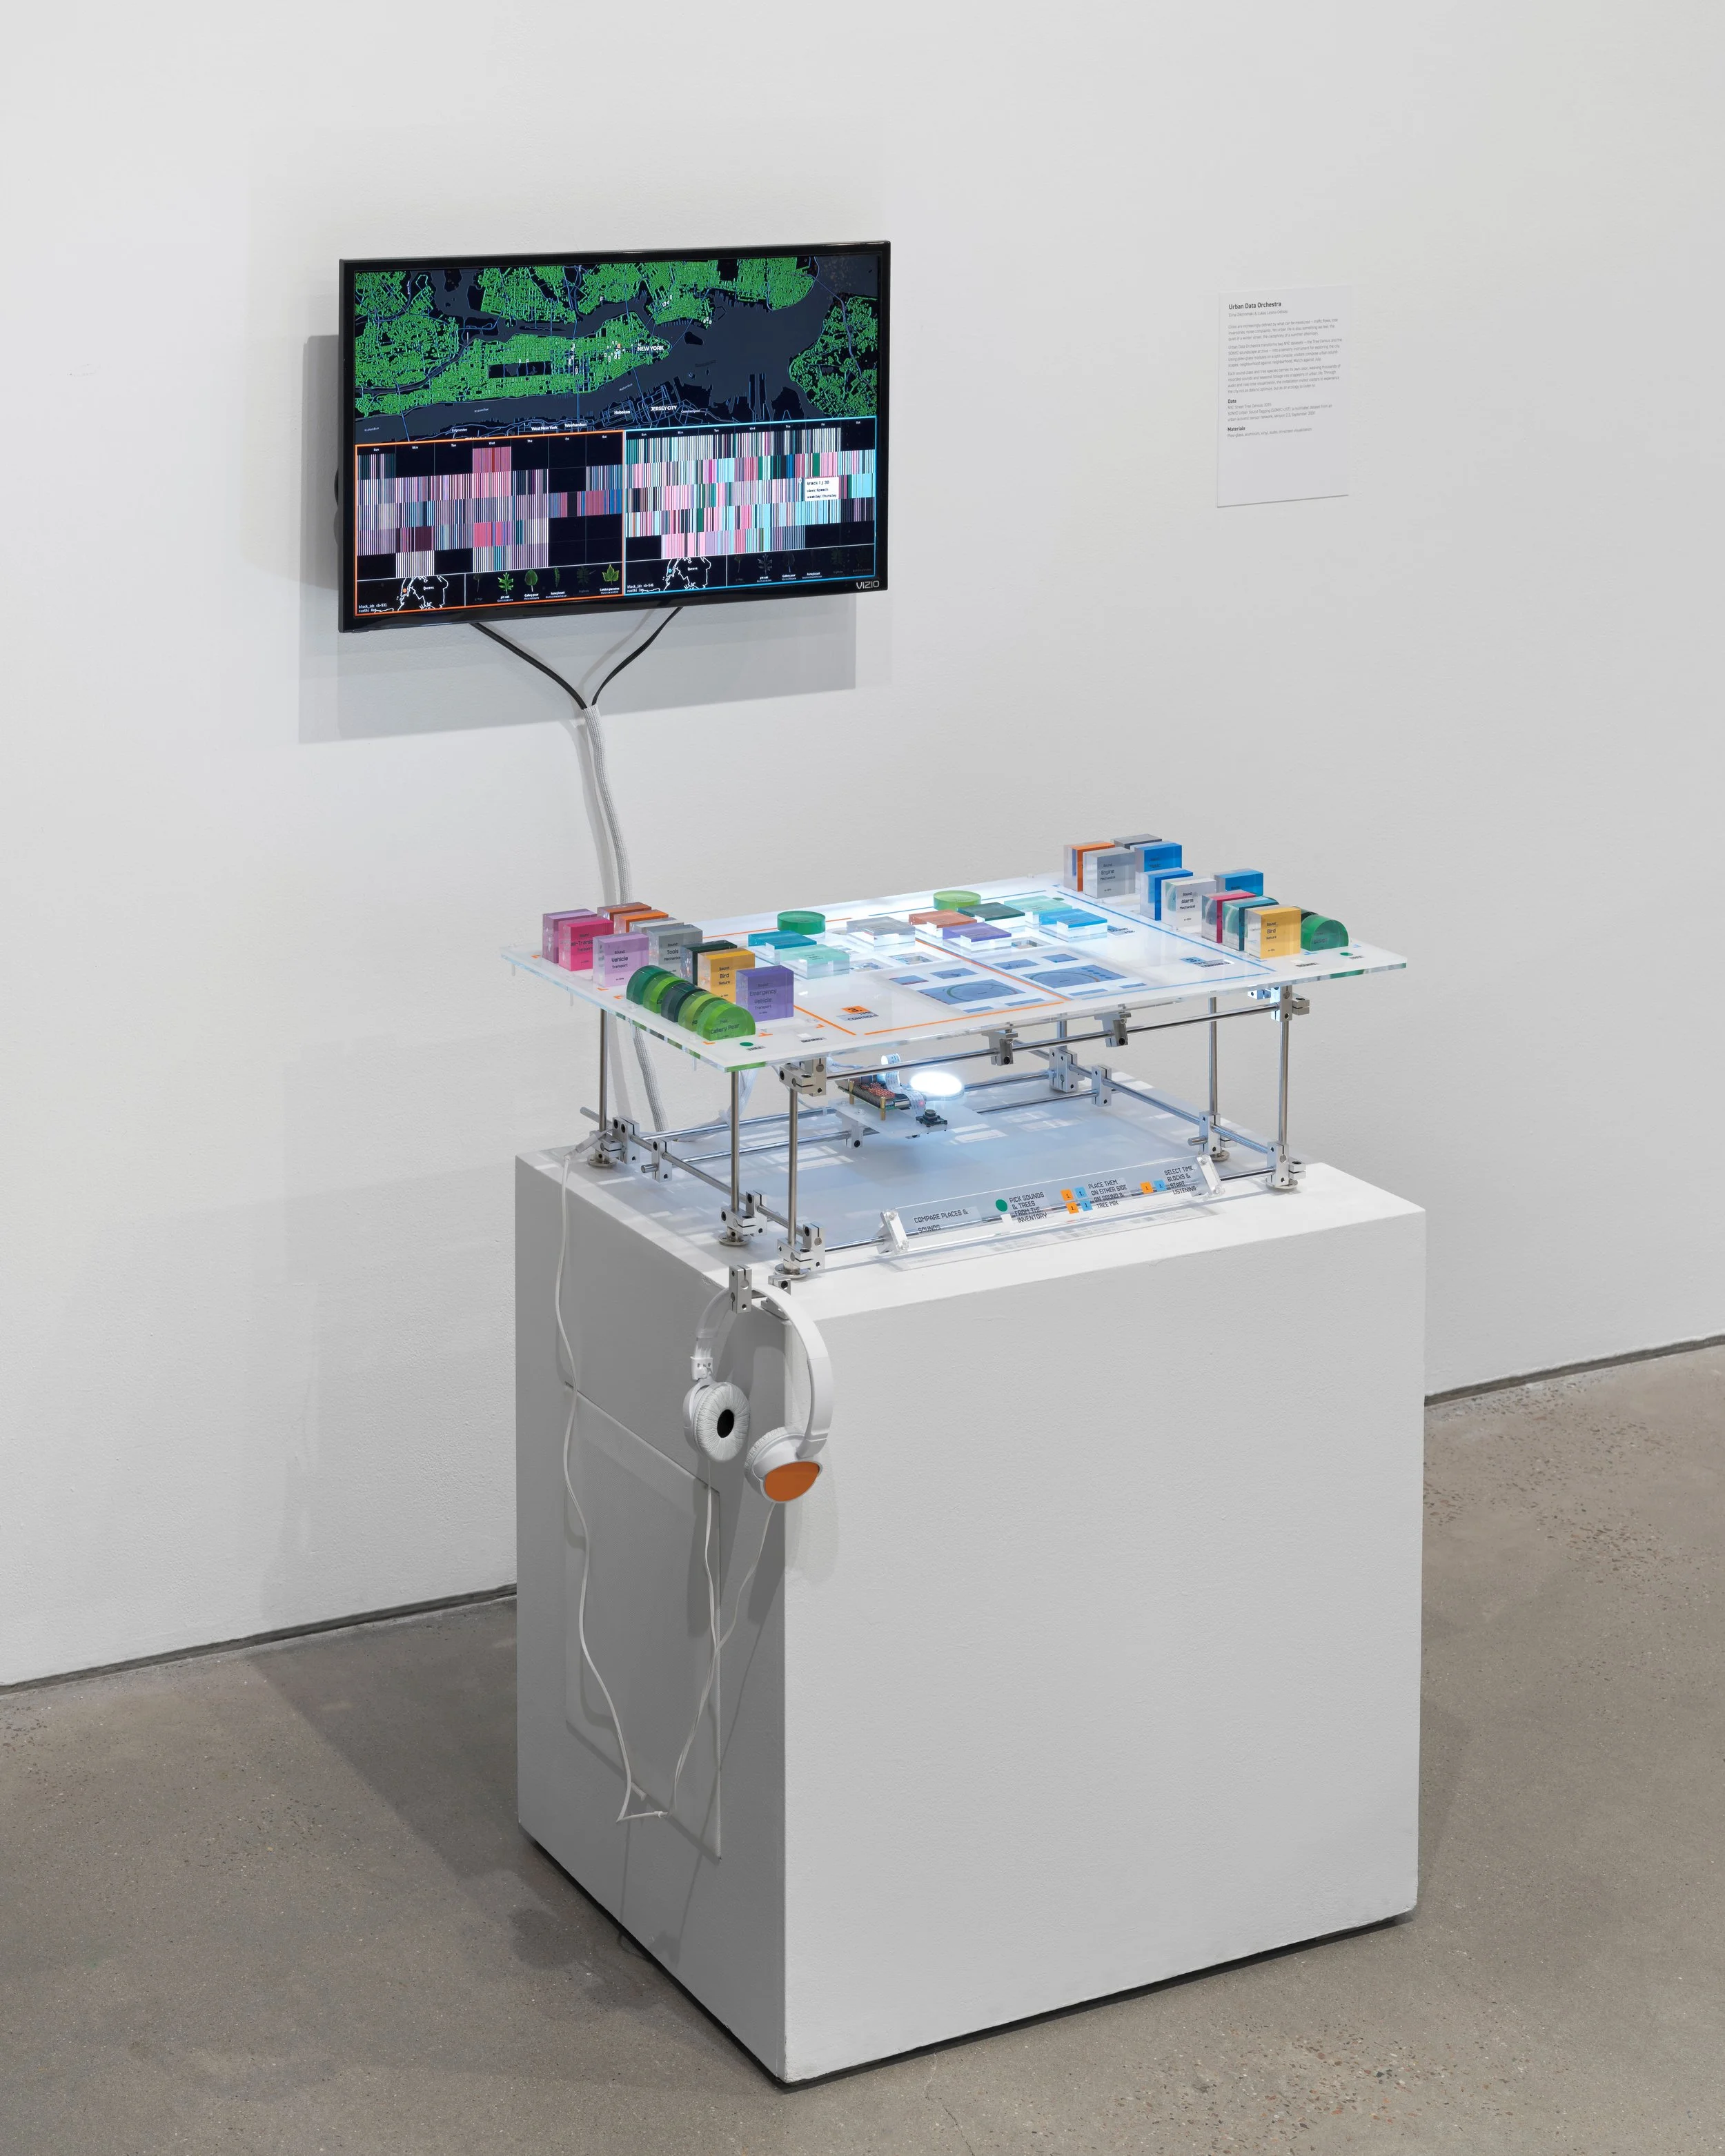
Cities are increasingly defined by what can be measured — traffic flows, tree inventories, noise complaints. Yet urban life is also something we feel: the quiet of a winter street, the cacophony of a summer afternoon.
Urban Data Orchestra transforms two NYC datasets — the Tree Census and the SONYC soundscape archive — into a sensory instrument for exploring the city. Using plexi-glass modules on a split console, visitors compose urban soundscapes: neighborhood against neighborhood, March against July.
Each sound class and tree species carries its own color, weaving thousands of recorded sounds and seasonal foliage into a tapestry of urban life. Through audio and real-time visualization, the installation invites visitors to experience the city not as data to optimize, but as an ecology to listen to.
Elina Oikonomaki & Lukas Lesina Debiasi
Datasets used:
Waste Rhythms: Living Records of NYC Communities
Waste usually lives on the darker side of city life. We rarely notice trash and garbage unless bags start piling up along the streets. Yet waste is far closer to us than we think. It reveals how we consume and how we live, serving as evidence of human activity and a signal of a community’s vitality or decay.
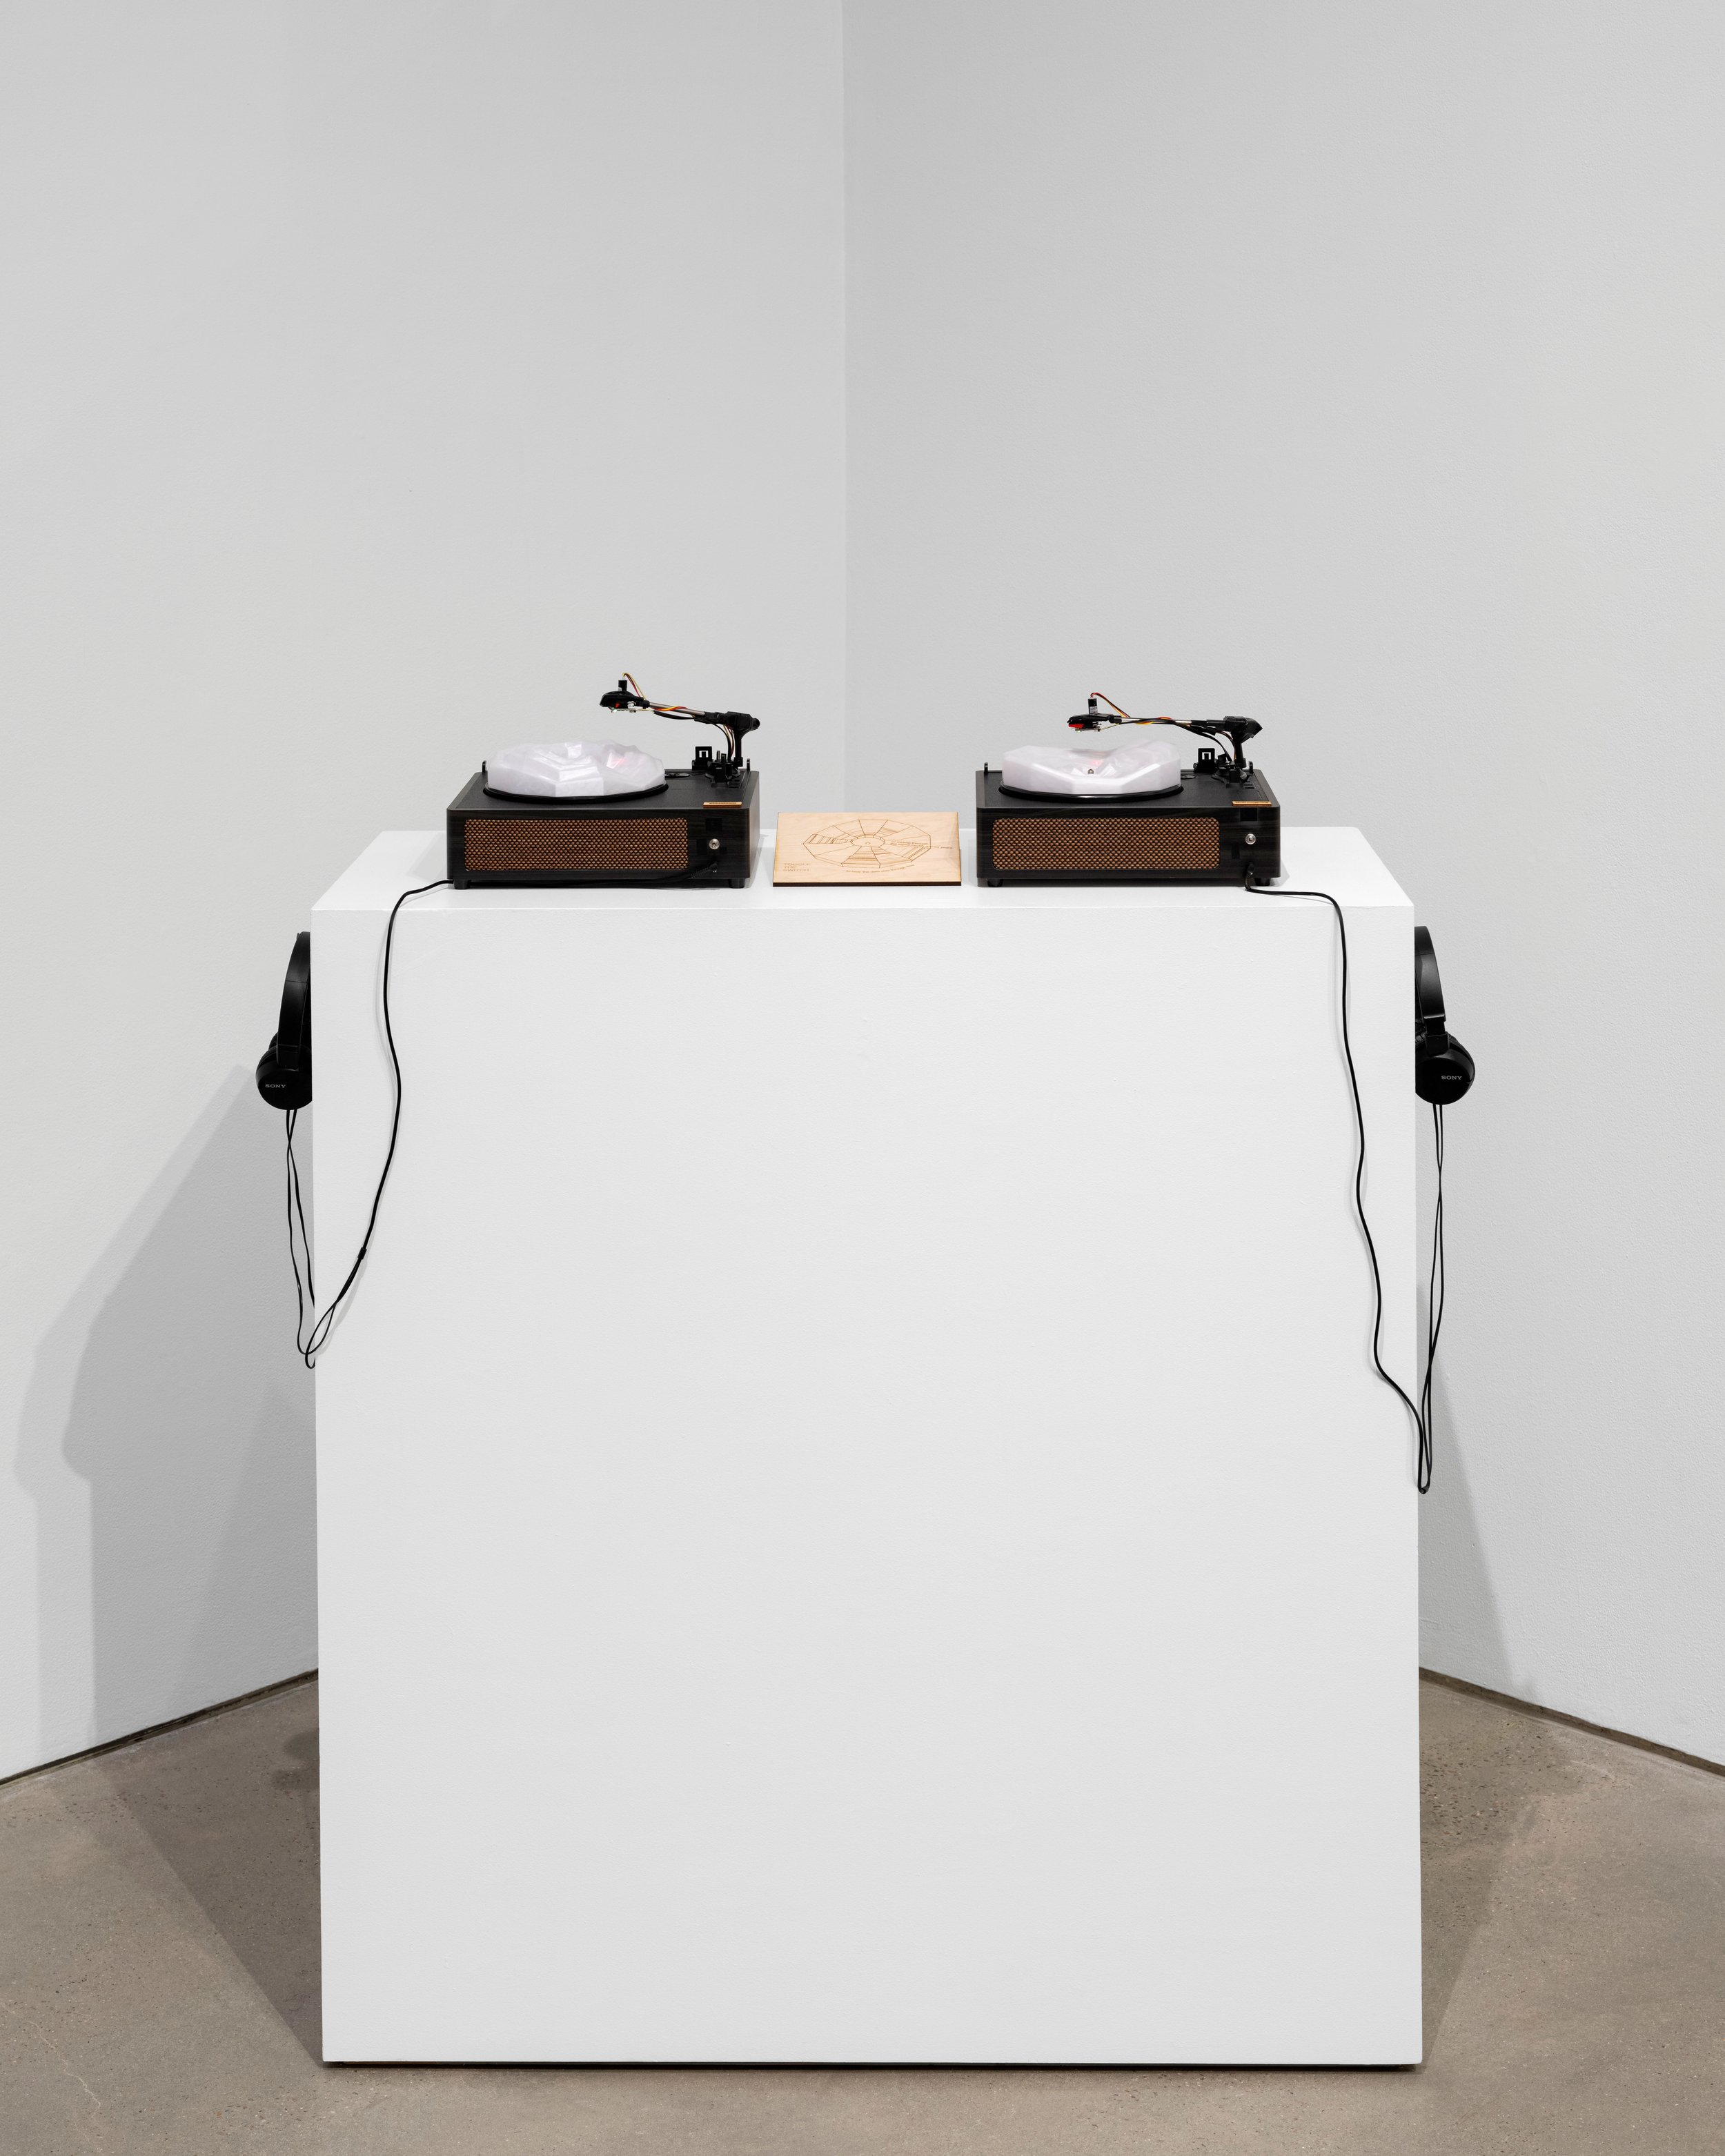
Waste Rhythms is a living data sculpture that turns New York City sanitation data into data vinyl—fabricated circular records that encode years of neighborhood waste data as concentric rings, with twelve segments around the circle representing months. Like the growth rings of a tree, the discs accumulate traces over time. Subtle rises and falls in surface height mark periods of expansion and decline, forming a data terrain of each neighborhood.
A custom-built player slowly spins the discs, while a stylus reads the rings with a sensor and translates these data into synthesized sound in real-time, allowing patterns in the data to be heard as a living sonic landscape. By transforming urban changes into form and sound, Waste Rhythms invites visitors to interact and experience the city's communities as a living pulse of change and memory.
HaoChe Hung & Tianxing (Vincent) Zhu
Datasets used:
Wild Lots
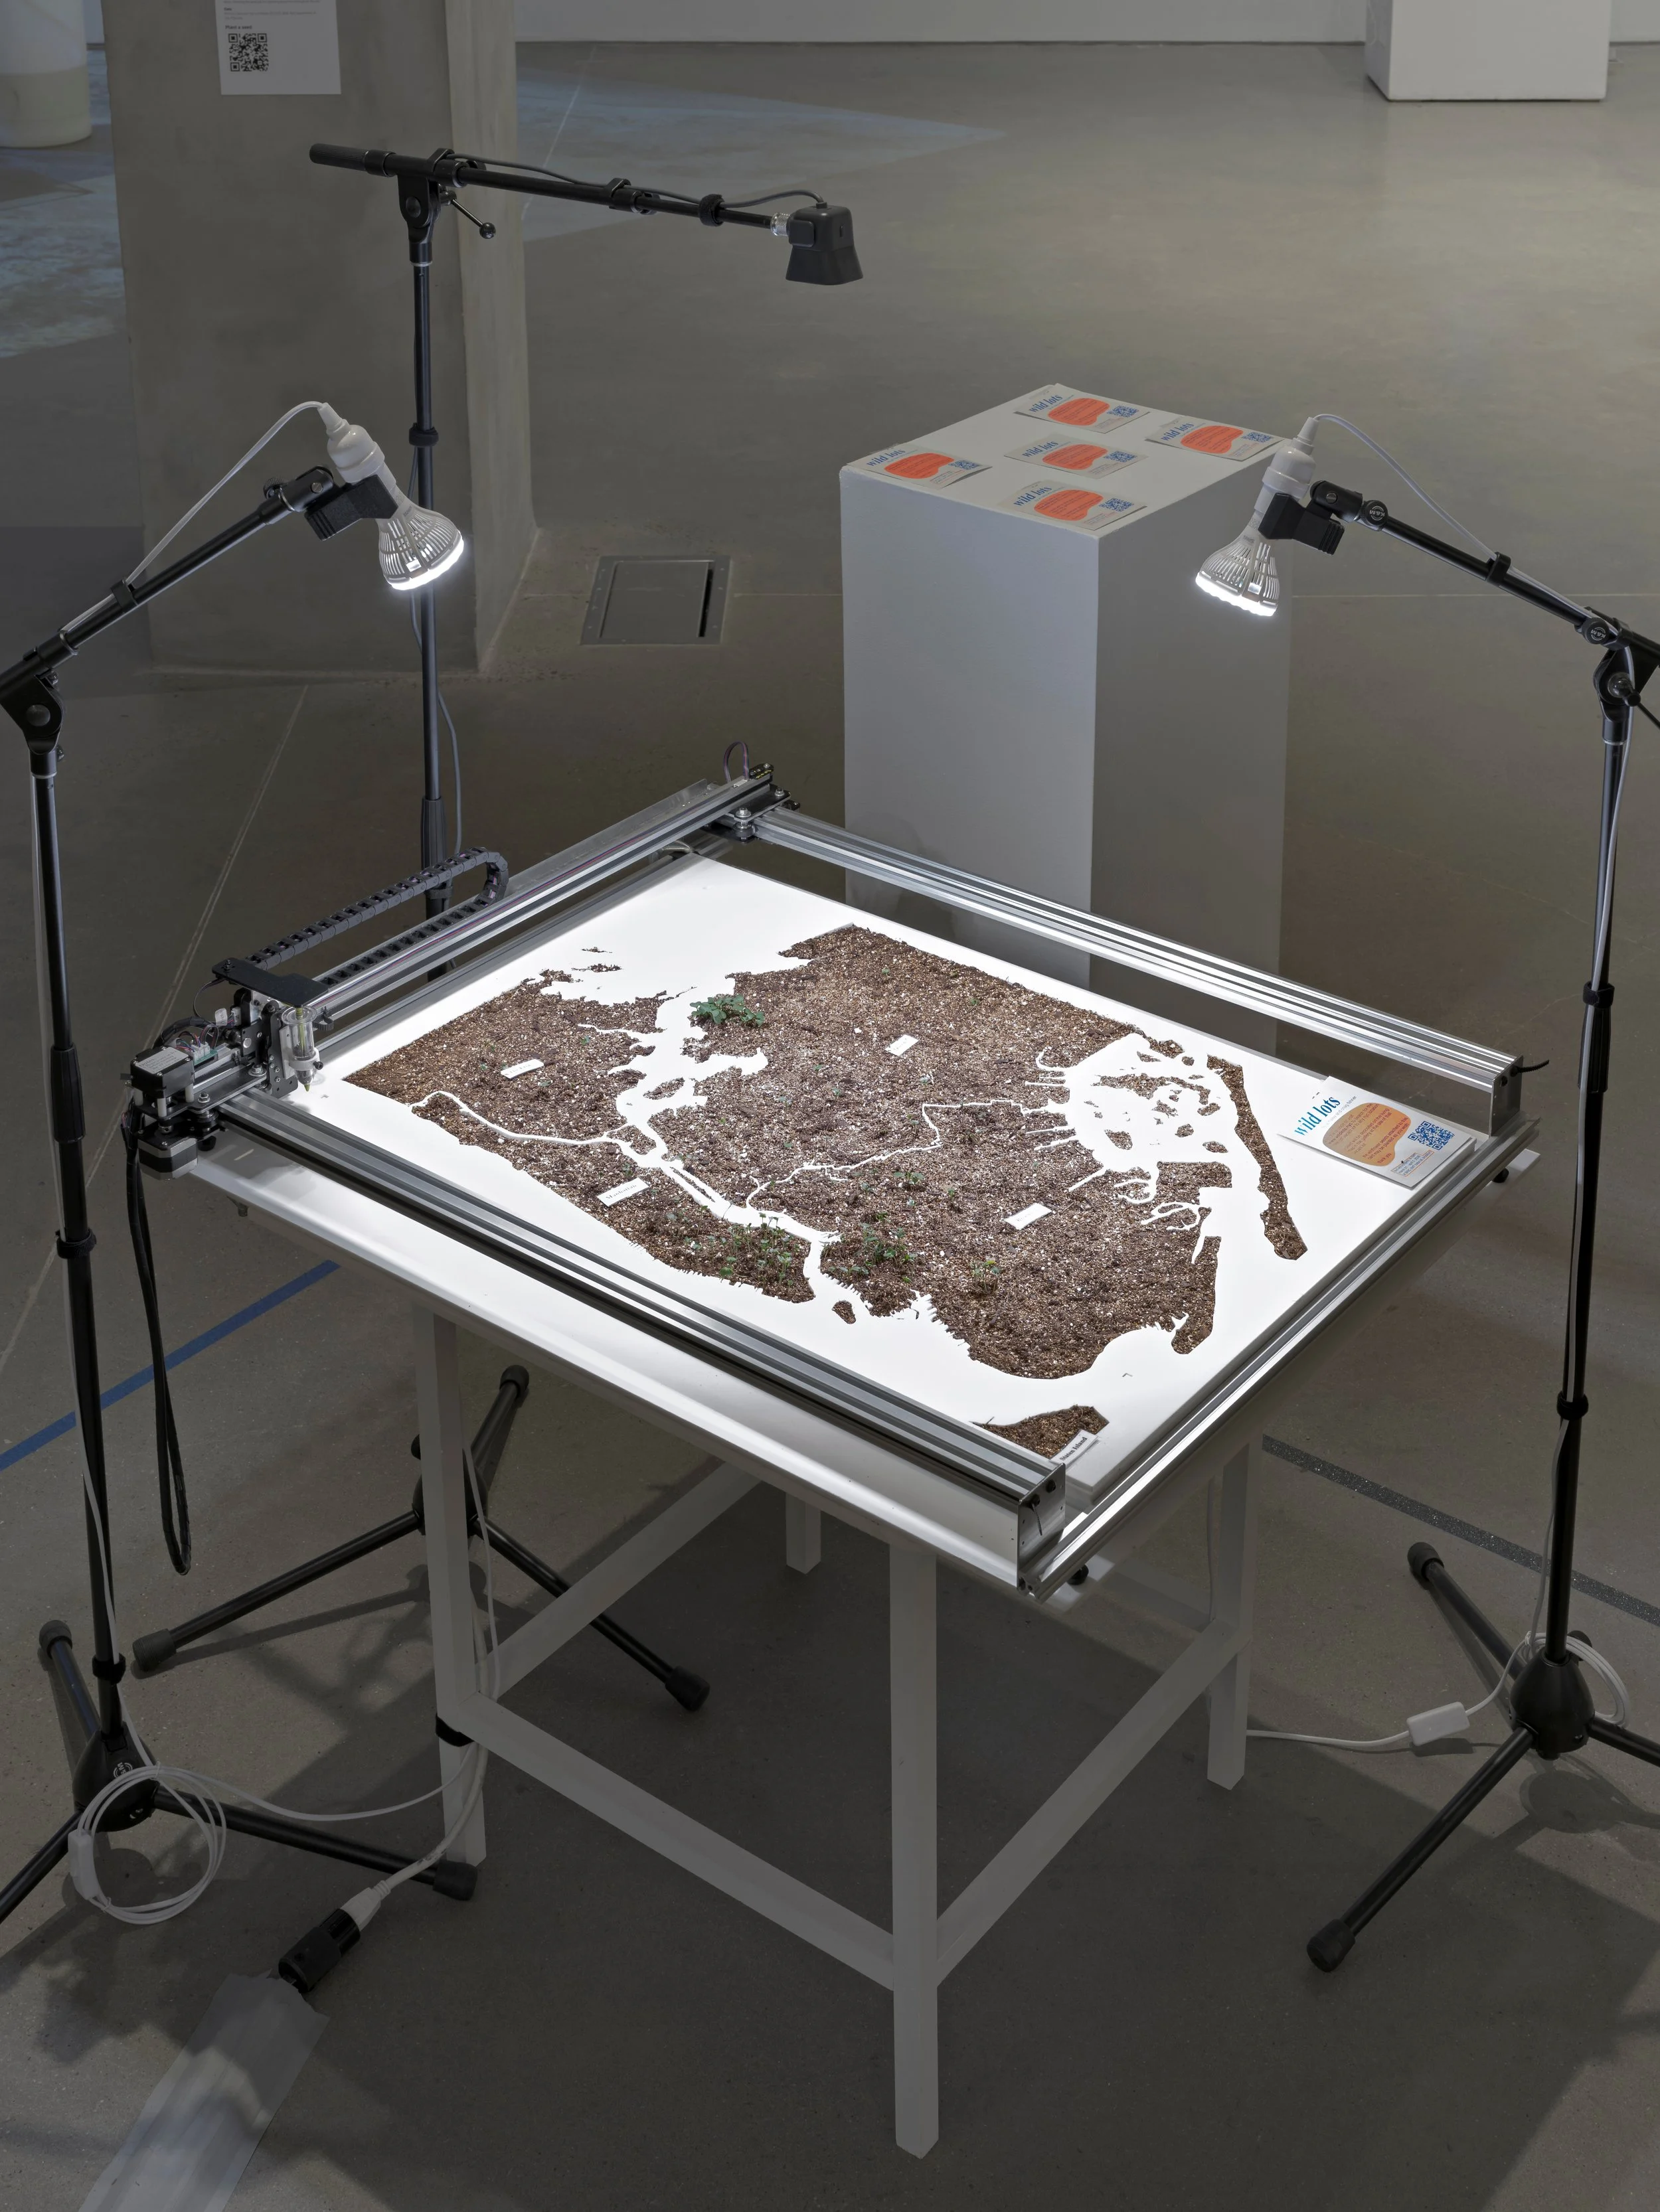
Wild Lots interprets NYC land use data to encourage speculative thinking about the lifecycles of urban spaces, imagining how vacant lots could be returned to nature. This interactive work consists of a garden bed formed in the shape of New York City, outfitted with a customized digital plotter that deposits seeds on the soil-based map. By scanning a QR code in the installation, viewers use their mobile devices to specify a location in New York City, and Wild Lots will query land use data to locate the nearest vacant lot to that address. The plotter’s seed-depositing mechanism is then activated, placing seeds at the site of the vacant lot which will sprout over the course of the exhibition, reflecting the potential for rewilding empty lots throughout the city.
Craig Fahner & A.L. Haley
Datasets used:
Sponsors

Presented by BRIC


New York State Council on the Arts with the support of the Office of the Governor and the New York State Legislature
Pratt Academic Senate
DxD is a Fund for the City of New York (FCNY) partner project
2026 DxD Organizers
Julia Bloom, Tereza Chenaki, Rachel Daniell, Jack Darcey, Sara Eichner, Justin Roberts, Can Sucuoglu