Data Through Design 2018
Data Through Design’s very first exhibit was held at the Made in NY Media Center by IFP in Dumbo, Brooklyn. The inaugural event featured eight works that asked questions about life in New York City to surface stories often hidden in data. The works included a temporal memorial to victims of traffic crash fatalities, an interactive exploration of data misinterpretation, and an immersive experience to communicate what it’s like to be caught in the web of over-policing for low level crimes.

8 Questions for the City
For 2018’s theme, 8 Questions for the City, pieces were selected that address issues like: what consequences do our choices about zoning have for the people traveling our streets? Or, what do NYC civil servants do? Collectively, these works reveal insights from a cumulative whole and demonstrate what stories can emerge from data.
Projects and Artists
Slow Down
Ellen Oh

Datasets: Vision Zero Data Feeds - Crash Data, Fatalities by Year
Do you feel anxious and unsafe crossing the streets of New York City? How many times have you turned your bike into a puddle to avoid pedestrians? Are you constantly on high alert on the road to avoid bikers, pedestrians, or other drivers while driving? Pedestrians, bikers and drivers are stressed on the busy road. Are we safe from traffic accidents?
Slow Down is an art installation that visualizes 8 years of traffic crash fatalities in New York City from 2010 to 2017 on fluorescent and transparent acrylic panels. Transparency of the material allows to view the accumulation of data through layers as well as yearly data on each from any direction and informs that more than thousands of lives have been taken away from traffic crash over the past 8 years. Streets are the largest and busiest infrastructure of New York City. Based on personal experience, walking the crowded and busy New York City streets occupied by pedestrians, bike riders, and cars may cause anxiety and fear. Evidently, NYC Open Data confirms fatalities and injuries by traffic crash occur everyday and with more than 200 fatalities and 50,000 injuries total every year. Slow Down aims to bring awareness to this public infrastructure and transportation safety issue and hopes to reduce accidents by slowing down the pace and making safer choices. This Installation is also dedicated as a memorial piece to those thousand of lives lost and their families.
Manhattan Tree Topography
TWO-N

Dataset: 2015 Street Tree Census
Our project – Manhattan Tree Topography – is a celebration of New York City’s street tree population through a data-driven, wooden map. The map is based on the NYC Street Tree Census data and will showcase the diversity and volume of New York’s tree population. Each neighborhood is represented through a block in different height and material. The height signifies the amount of trees, whereas the wood represents the most prevalent tree. The sculpture is interactive: by picking up blocks the audience can uncover further information on NYC’s tree life and experience the haptic qualities of the wood
What our Numbers Don’t Show: the Story of Data Misinterpretation
Mathura Govindarajan & Davíd Lockard
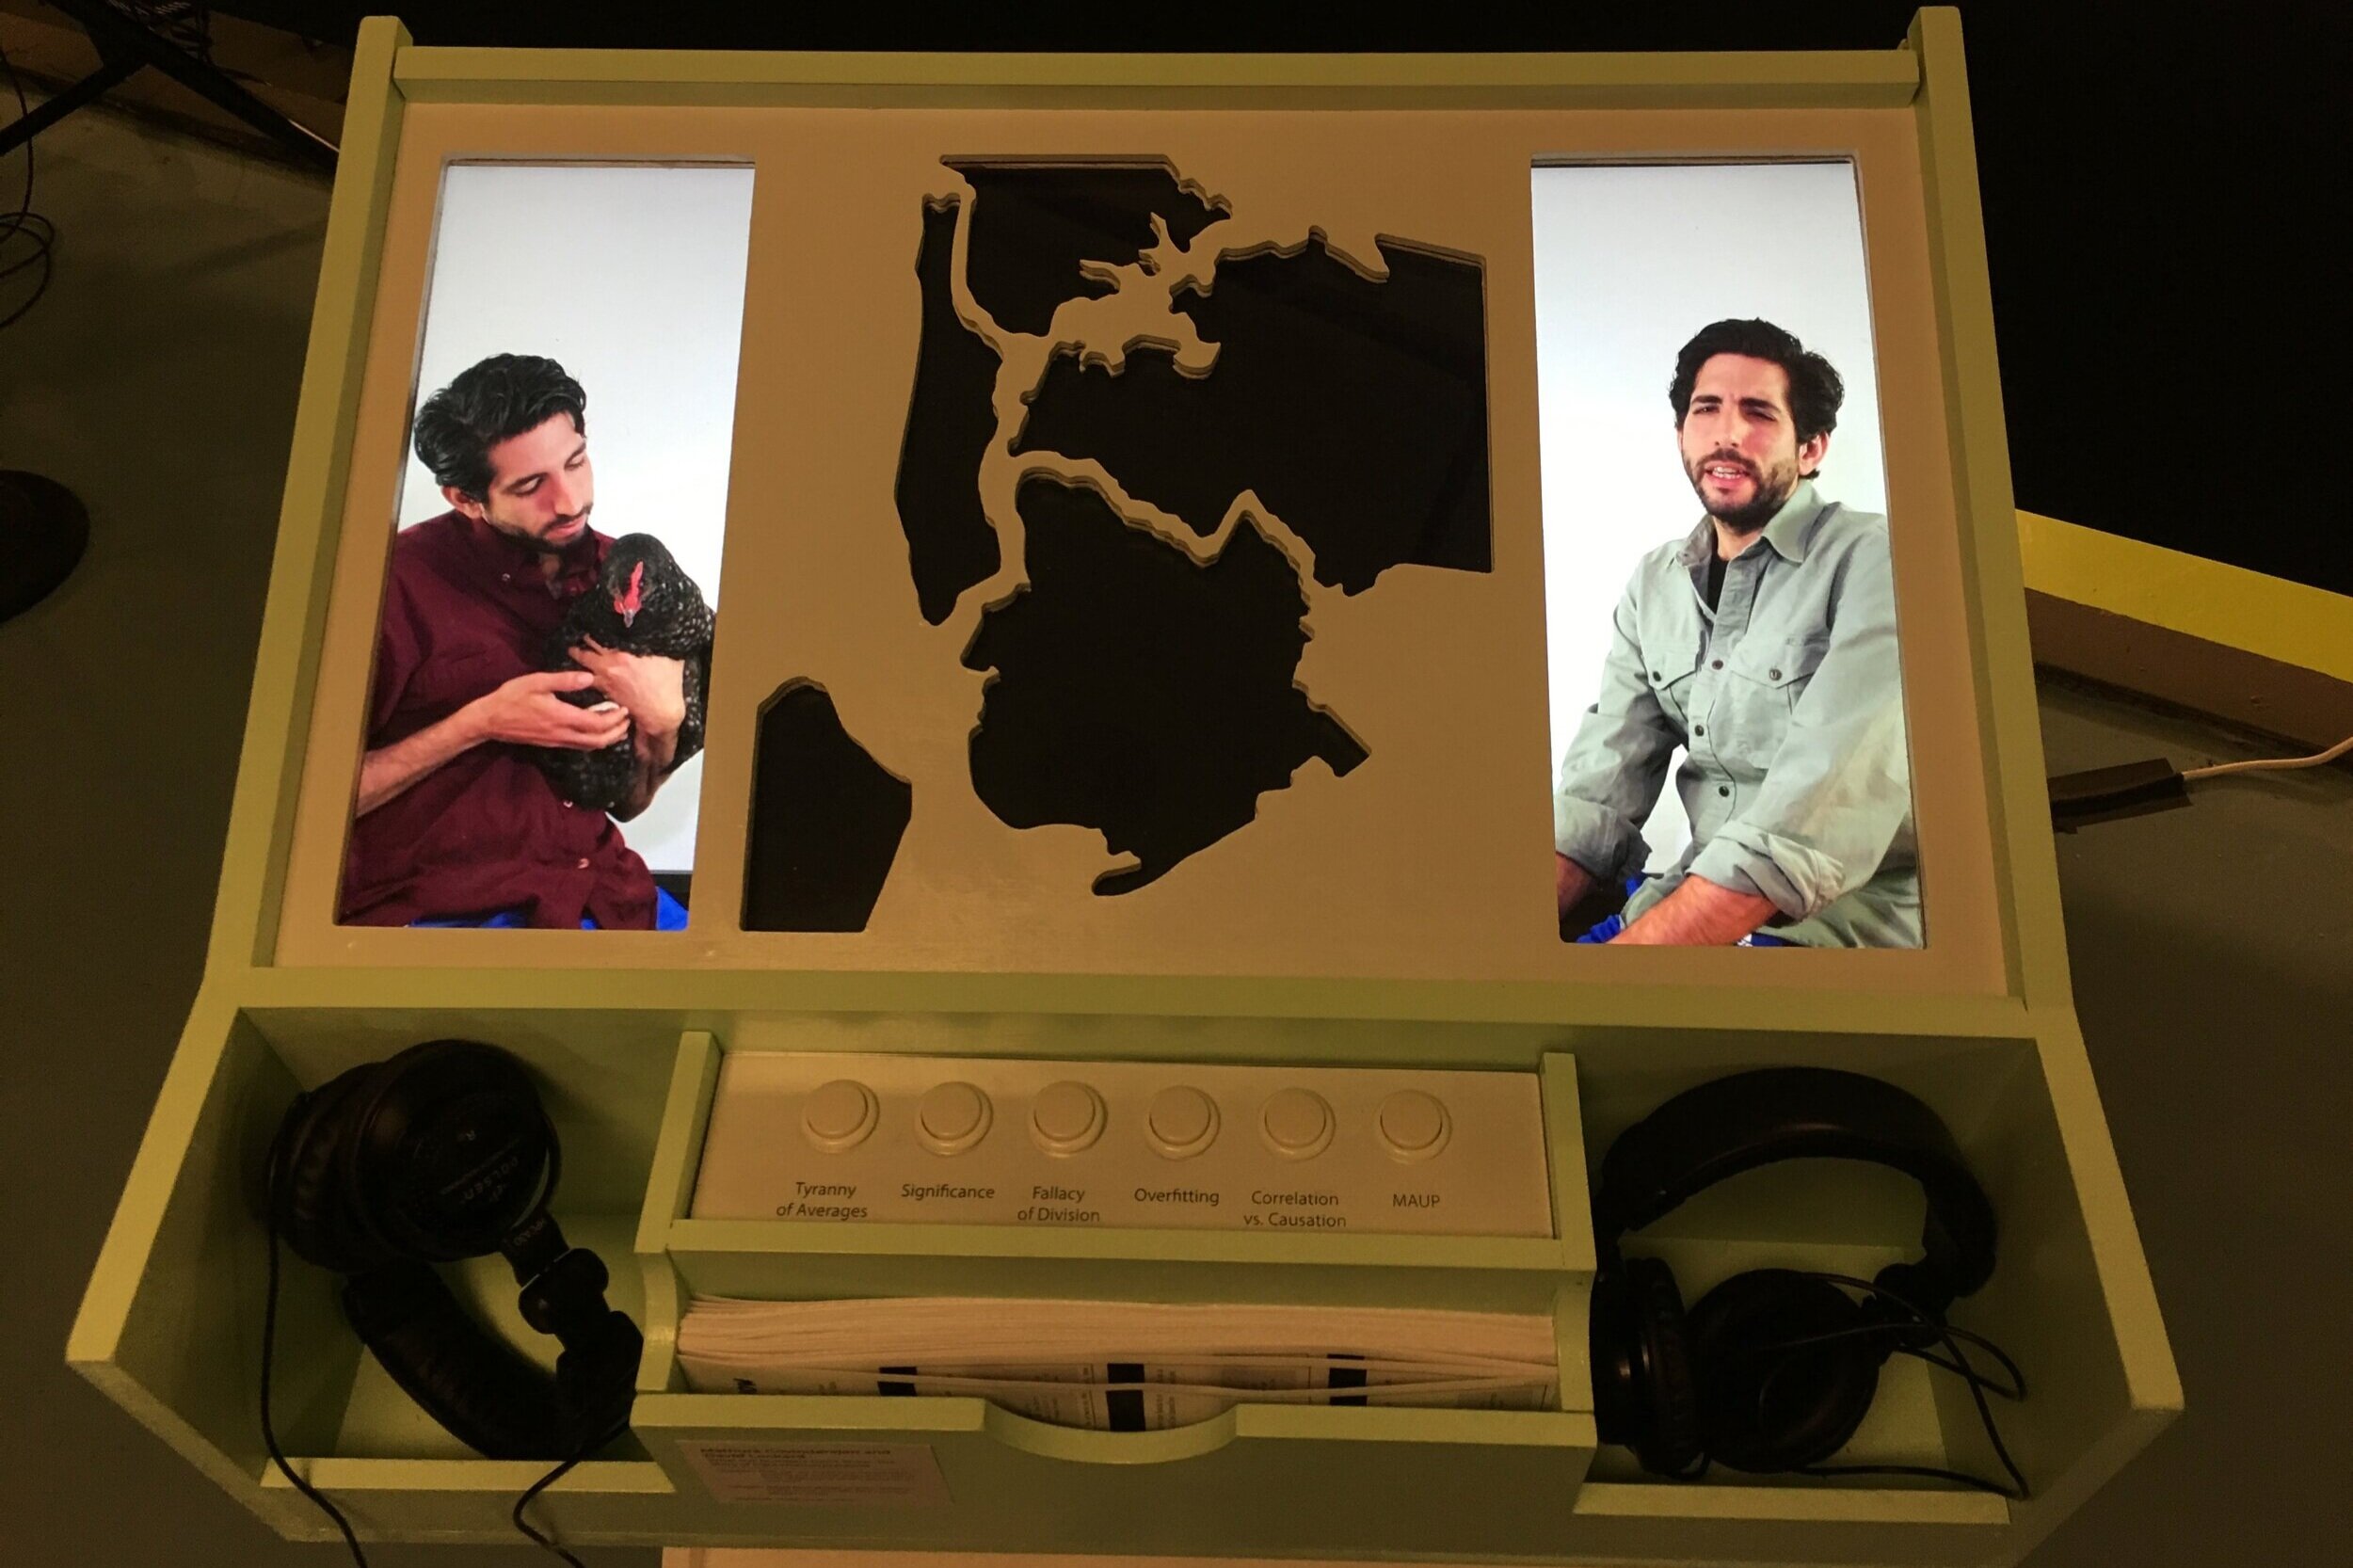
Datasets: Illegal Animal Kept as Pets, Street Tree Census, Toilets in Public Parks
How can we make sure we are interpreting our data in ways that help us truly understand what’s going on in our city?
This installation uses data to tell a story about how we tell our stories. An interactive, freestanding physical station, it humorously ‘misuses’ several NYC municipal datasets to illustrate ways in which data is commonly misinterpreted. By presenting the audience with a series of blatantly absurd deductions based on valid data, as well as an explanation of the methodological errors involved, it provides the audience with an introduction to key concepts of data analysis such as correlation vs. causation, bias, overfitting, and statistical anomalies. By employing tangible interaction, engaging humor and a clear, welcoming interface, we seek to encourage visitors to listen closely to how the stories we are told (and tell ourselves) about the city and the people in it are constructed - as well as the importance of maintaining a critical view toward these stories.
The Time of Sexual Trauma
So Yeon (Soy) Jeong & Ye Eun Jeong

Dataset: Rape and Sex Crimes
How does sexual violence live in the collective time of New York City?
This piece explores the intersection of Time and sexual violence. Using the dataset titled Rape and Sex Crimes based on NYPD Compliant Data Historic, the piece visualizes the Time (time of day, length of reported occurrence, date) of reported sex crimes. Programmed LED lights signify when in the day the reported sex crime occurred. As a clock goes through the hours of the day in sped up time, 365 lights representing the days of 2016 light up signifying a sex crime has occurred at the given time.
Patterns appear as bursts of light, showing not necessarily when the violence occurs, but how it is recorded by the NYPD. In the collective memory of bureaucracy and the NYPD, the time of sexual trauma is rounded up to the hour or the half an hour. It is estimated that only about 40% of sex crimes are reported to the police according to RAINN, the nation’s largest anti-sexual violence organization. And sexual misconduct by the police is even less likely to be reported. And so we return to the question, how does sexual violence live in the collective time of New York City?
Broken Windows and Pink Tickets
Jill Hubley

Datasets: Criminal Court Summonses, Population, Police Precincts
How is low-level crime policed throughout NYC?
Using criminal court summonses data, I'm exploring geographic patterns of broken windows policing in New York City. The concept behind the broken windows theory is that maintaining an orderly urban environment and cracking down on low-level crime will deter the advent of more serious crime. In my installation, parachute cords in a multitude of colors hang down, each representing the number of summons issued for a particular violation in one of NYC's 78 police precincts. The colors map to the different violations, which include a wide range of infractions (trespassing, spitting in public, and having an unleashed dog are just a few). Visitors are encouraged to walk through the installation to traverse the city and immerse themselves in the information. Where there are a great number of summonses, the strings will reach the floor; where there are fewer, the strings will hang above the visitors’ heads.
New York City Seeks
Talented Individuals
To Compose Haikus
Jeremy Neiman

Datasets: NYC Jobs
What are the duties of New York City's civil servants?
The New York City government employs almost 400,000 people. From performing manual labor and infrastructure maintenance to creating innovative methods for reducing waste, homelessness and crime, civil servants keep this city running. Bringing to light the work government employees do for all of us, this piece uses the current NYC government job descriptions to algorithmically generate haikus. Lured by their simplicity and beauty, the artist chose the conventional haiku form, which is traditionally used to ponder the wonder of nature, as an unconventional platform for his subject. Through this whimsical piece, labor and bureaucracy are elevated to poetry.
How We Die
Juan Francisco Saldarriaga & Steven Sanchez

Datasets: Leading Causes of Death
How do we die in New York City?
Each year around 50,000 people die in the city. Most of them from heart disease or cancer, others from diabetes or murder. But the causes of death remain varied and changing, and affect different populations differently. They are also growing or declining through time, and our methods for collecting, classifying and reporting death are changing as well.
We propose to make sense of this varied terrain through a dynamic and ethereal sculpture. With a topographic installation we will represent the leading causes of death in New York City, and their evolution from 2007 to 2014. Cycling through different configurations, the sculpture will morph and transform to display how these same causes of death act the different ethnic groups as well as the different genders. Ultimately, our installation will allow the spectator to understand the topography of death in New York.
Life or Death in the Built Environment
James Proctor & Pitch Interactive

Datasets: Zoning, Traffic Fatalities
What consequences do our choices about zoning have for the people traveling our streets?
Life and Death in the Built Environment demonstrates the consequences of how we choose to construct our city. Like most American cities, zoning has had a profound effect on the shape of New York, and the lives of it’s citizens. This piece is designed to prompt questions about who is empowered to make these decisions, how these choices effect our perception of a place's character, and who is welcomed or put at risk as a result.
Artists


Sponsors
Pratt Institute
CARTO
Enigma
Made in NY Media Center by IFP
Brown Institute for Media Innovation
2018 DxD Organizers
Jessie Braden, Wenfei Xu, Eve Ahearn, Michelle Ho, Stuart Lynn
Photography by Sam Hyatt Photography